The topic of exhaustible resources often comes up in every
advertisement
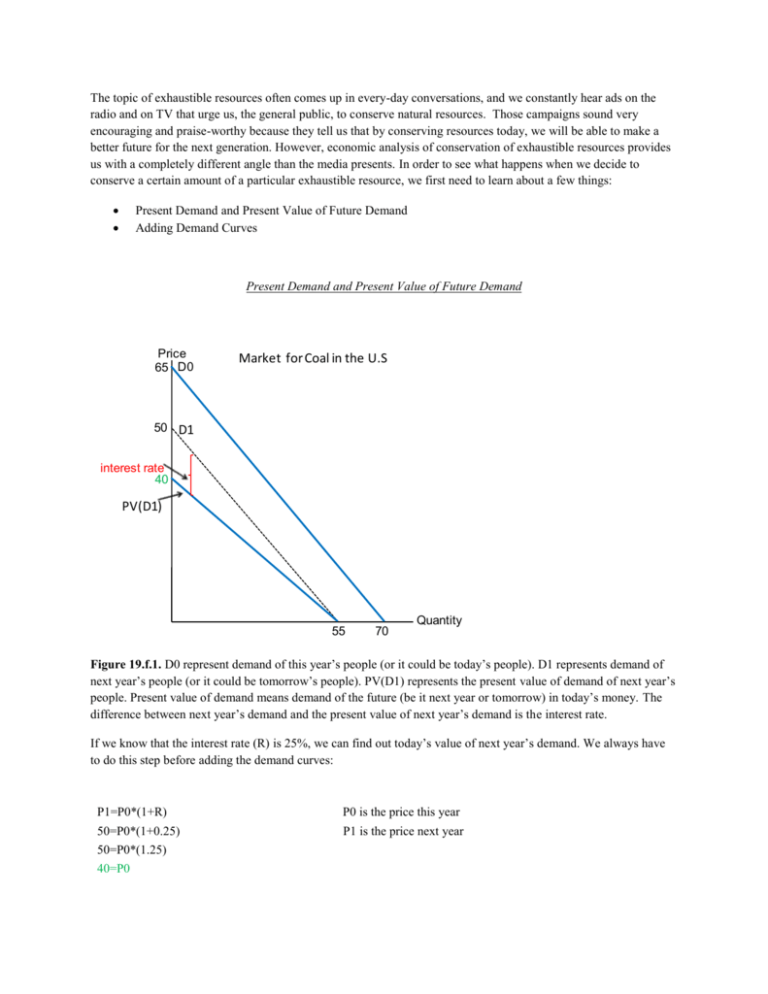
The topic of exhaustible resources often comes up in every-day conversations, and we constantly hear ads on the radio and on TV that urge us, the general public, to conserve natural resources. Those campaigns sound very encouraging and praise-worthy because they tell us that by conserving resources today, we will be able to make a better future for the next generation. However, economic analysis of conservation of exhaustible resources provides us with a completely different angle than the media presents. In order to see what happens when we decide to conserve a certain amount of a particular exhaustible resource, we first need to learn about a few things: Present Demand and Present Value of Future Demand Adding Demand Curves Present Demand and Present Value of Future Demand Price 65 D0 Market for Coal in the U.S 50 D1 interest rate 40 PV(D1) 55 70 Quantity Figure 19.f.1. D0 represent demand of this year’s people (or it could be today’s people). D1 represents demand of next year’s people (or it could be tomorrow’s people). PV(D1) represents the present value of demand of next year’s people. Present value of demand means demand of the future (be it next year or tomorrow) in today’s money. The difference between next year’s demand and the present value of next year’s demand is the interest rate. If we know that the interest rate (R) is 25%, we can find out today’s value of next year’s demand. We always have to do this step before adding the demand curves: P1=P0*(1+R) P0 is the price this year 50=P0*(1+0.25) P1 is the price next year 50=P0*(1.25) 40=P0 We have two demand curves now, but we cannot calculate the equilibrium point using a supply curve and two demand curves. Therefore, we need to add this year’s demand and the present value of next year’s demand in order to obtain Aggregate Demand. We horizontally add the two demand curves: Price 65 Market f or Coal in the U.S. D0 Supply 50 D1 40 PV(D1) ∑ Do+PV(D1) 35 7 32 55 70 125 Quantity Figure 19.f.2. The red line represents the horizontal sum of D0 and PV(D1). The aggregate demand curve is identical with D0 up to the point where PV(D1) starts (point of the y-intercept of PV(D1)). The blue dot is at the intersection of the aggregate demand curve and our supply curve. This point is the equilibrium point. Consequently, the equilibrium price is $35 and the equilibrium quantity is 125 gallons. The quantity this year’s people want to consume is 32 and the quantity next year’s people want to consume is 7. Notice that in order to see how much next year’s people want to consume, we disregard D1 and look at PV(D1). Now, suppose that the government was concerned that next year’s people will not have enough coal and therefore made this year’s people conserve 5 tons. That means that this year’s people will now be able to consume only 27 tons (32-5), but next year’s people will have 12 tons instead of 7 tons. That sounds like fair game. However, let’s see what happens when we put these changes on the above graph: Price 65 Market f or Coal in the U.S. D0 Supply 50 D1 40 PV(D1) ∑ Do+PV(D1) 35 benefit B 7 12 A 27 32 55 70 125 Quantity loss Figure 19.f.2. Area A represents the loss for this year’s people. Area B represents the gain for next year’s people. We immediately see that the loss is bigger than the gain, meaning that the society as a whole is worse off because of forced conservation of exhaustible resources. That seems counter-intuitive, but what is really happening here is this: next year’s people value their resources less because they now have more of them, and this year’s people value their resources more because they have less of them. Practice Problems 1. Suppose the equation for D1 is P=300-Q Suppose the interest rate is 20%. What is the PV(D1)? Is the x- intercept of D1 the same as the x-intercept of PV(D1)? Will this always be the case? Why? 2. The interest rate is 5%. Looking at the diagram below, answer the following questions: a) b) c) d) e) Find PV(D1) Draw PV(D1) on the graph Draw aggregate demand Show quantity demanded today on the graph Show quantity demanded tomorrow on the graph Market for oil in the U.S Price 65 Supply D1 30 D0 1000 3. 2000 Quantity Looking at the diagram below, explain what happens if we force today’s people to consume 100 units less so that next year’s people can consume 100 units more and we know that Q0=300 , Q1=800 , and the equilibrium price=$18. If we enforce this measure in order to save oil for the future generation, will the society as a whole benefit or lose? Show this on the diagram and calculate the net benefit or the net loss to society. Market for oil in the U.S. Price Supply 48 PV(D1) 30 D0 1000 1100 2000 Quantity Solutions 1. P1=P0(1+R) D1: P=300-Q R=0.20 X intercept Therefore, the x-intercept of D1 and PV(D1) is always going to be the same 300-Q = P0 (1+0.20) 300-Q = P0 (1.2) 250- (Q/1.2) = P0 250-1/1.2 Q = P0 PV(D1) X intercept 2. a) 65-(65/2000)Q=P0(1+0.05) 65- 0.0325=1.05 P0 64.9675=1.05P0 61.87≈62=P0=PV(D1) Market for oil in the U.S. Price 65 62 30 Supply D1 D0 ∑ Do+PV(D1) Q0 1000 Q1 PV(D1) 3. 2000 Quantity Market for oil in the U.S. Price Supply 48 30 D0 18 ∑ Do+PV(D1) loss 200 300 900 1000 1100 800 gain 2000 PV(D1) From the graph, we can clearly see that the gain is smaller than the loss. Loss: 18(100)+(1/2)(100)(24-18)=2100 Gain: 16.5(100)+(1/2)(18-16.5)(100)=1725 Net Loss: 2100-1725=375 Quantity
