Materials and Methods - Mr-Paullers-wiki
advertisement
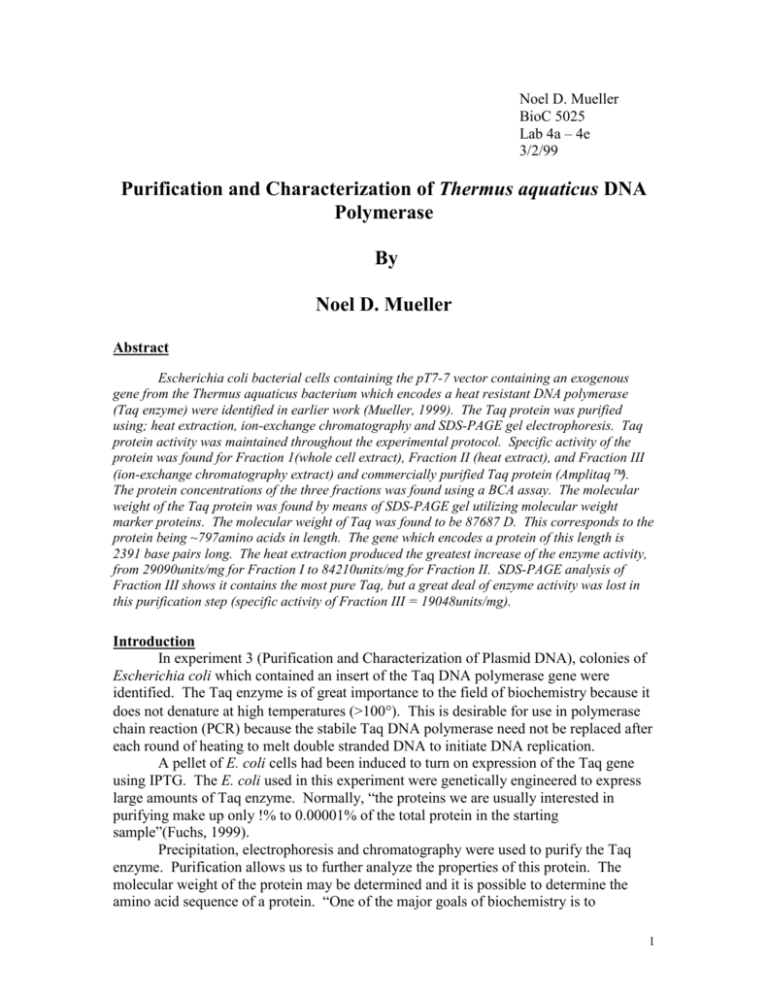
Noel D. Mueller BioC 5025 Lab 4a – 4e 3/2/99 Purification and Characterization of Thermus aquaticus DNA Polymerase By Noel D. Mueller Abstract Escherichia coli bacterial cells containing the pT7-7 vector containing an exogenous gene from the Thermus aquaticus bacterium which encodes a heat resistant DNA polymerase (Taq enzyme) were identified in earlier work (Mueller, 1999). The Taq protein was purified using; heat extraction, ion-exchange chromatography and SDS-PAGE gel electrophoresis. Taq protein activity was maintained throughout the experimental protocol. Specific activity of the protein was found for Fraction 1(whole cell extract), Fraction II (heat extract), and Fraction III (ion-exchange chromatography extract) and commercially purified Taq protein (Amplitaq). The protein concentrations of the three fractions was found using a BCA assay. The molecular weight of the Taq protein was found by means of SDS-PAGE gel utilizing molecular weight marker proteins. The molecular weight of Taq was found to be 87687 D. This corresponds to the protein being ~797amino acids in length. The gene which encodes a protein of this length is 2391 base pairs long. The heat extraction produced the greatest increase of the enzyme activity, from 29090units/mg for Fraction I to 84210units/mg for Fraction II. SDS-PAGE analysis of Fraction III shows it contains the most pure Taq, but a great deal of enzyme activity was lost in this purification step (specific activity of Fraction III = 19048units/mg). Introduction In experiment 3 (Purification and Characterization of Plasmid DNA), colonies of Escherichia coli which contained an insert of the Taq DNA polymerase gene were identified. The Taq enzyme is of great importance to the field of biochemistry because it does not denature at high temperatures (>100). This is desirable for use in polymerase chain reaction (PCR) because the stabile Taq DNA polymerase need not be replaced after each round of heating to melt double stranded DNA to initiate DNA replication. A pellet of E. coli cells had been induced to turn on expression of the Taq gene using IPTG. The E. coli used in this experiment were genetically engineered to express large amounts of Taq enzyme. Normally, “the proteins we are usually interested in purifying make up only !% to 0.00001% of the total protein in the starting sample”(Fuchs, 1999). Precipitation, electrophoresis and chromatography were used to purify the Taq enzyme. Purification allows us to further analyze the properties of this protein. The molecular weight of the protein may be determined and it is possible to determine the amino acid sequence of a protein. “One of the major goals of biochemistry is to 1 determine how amino acid sequences specify the conformations of proteins.” (Stryer, 1995). It is also desirable to purify Taq for use in PCR. The first step in the purification of Taq enzyme was a heat extraction. Bacterial cells were lysed to obtain a crude cellular protein extract. This extract was heated which causes many proteins to denature and fall out of solution. The Taq enzyme does not denature because it is derived from the genetic material of a thermophilic bacterium. It is important to check enzymatic activity at each step of a purification. A PCR primer-dimer assay was used to ensure that Taq activity was not lost at any step of the purification. PCR provides a means to make DNA replicate in a test tube. It works by extending a primer with DNA polymerase. A 5’ primer and a 3’ primer will form a dimer. Multiple rounds of heating, which will cause the dimer to melt (into two single strands), and a round when cooler temperatures allow new primers to anneal and are also extended. In this fashion, the DNA primer-dimers may be amplified in an exponential manner. The DNA is doubled with each round of melting and annealing. A single strand of DNA may be amplified to over 1,000,000 copies after 20 rounds in a PCR cycler. Samples containing active Taq protein will amplify the primer-dimer DNA and this result can be checked using gel electrophoresis. Gel electrophoresis works by a power source being used to create a positive and negative terminal in a gel box. DNA, which is negatively charged, will be pushed through a porous agarose gel towards the positive terminal. Using EtBr allows the DNA bands in the gel to be visualized under ultraviolet light. A unit of enzyme activity for Taq polymerase is defined as the minimal amount of Taq protein required to give a positive result (amplified DNA band visible in the agarose gel) in the primer-dimer PCR assay. The Taq protein was further purified using ion exchange chromatography. For this experiment, a column chromatography was set up using diethyl aminoethyl (DEAE) and cellulose (an inert polymer). DEAE is positively charged at below pH 9. Different proteins have different net charges because of ionizable groups present in the protein. This fact means that different proteins will have differing affinities for the charged functional groups (DEAE). Proteins that bind to the DEAE will displace the Clcounterion. By passing increasingly concentrated Cl- solution through the column, proteins may be eluted based upon their differential column affinities. A protein with a lesser affinity for the column is eluted at a lower salt concentration than a protein with a high affinity for the column. The concentration of protein in solution can be found using a BCA assay. Proteins will react with Cu++ in a alkaline solution to yield Cu+. Bicinchoninic acid will turn purple in the presence of Cu+. Two molecules of BCA react with one Cu+ to yield a BCA-Cu+ complex. The purple reaction product has a strong absorbance at 562nm. A standard curve may be prepared by using known amounts of protein. Linear regression analysis of the standard allows the calculation of protein in samples where the protein concentration is not known. A SDS-PAGE gel will allow for further characterization of the Taq enzyme. Sodium dodecylsulfate (SDS) is an anionic detergent which denatures proteins by wrapping around the polypeptide backbone (Fuchs, 1999). The SDS adds a net negative charge to the protein proportional to its length. This net negative charge on the protein will cause it to move in response to an electrical field, just as negatively charged DNA moves through an agarose gel in response to an electrical field. The SDS gel was run with molecular weight marker (MW) proteins; carbonic anhydrase (29000 D), ovalbumin (45000D), bovine serum albumin (66000 D), phosphorylase B subunit (97400 D), 2 galactosidase subunit (116000 D), and myosin subunit (205000 D). A linear relationship exists between the log10 of the molecular weight and the Rf (the distance a protein migrated on the gel), which allows the molecular weight of the Taq protein to be calculated. Lastly, the activity of the ion exchange column purified protein (Fraction III, FR III) was found by a primer-dimer PCR assay. The activity will again be defined as the minimal amount of Taq protein required to produce amplified DNA to give a positive result in the PCR assay. The activity of FR III was compared to the activity of Amplitaq. Materials and Methods Heat extraction: A cell pellet of Escherichia coli cells (from 30 ml of cell culture) which had been induced to produce Taq polymerase protein by adding IPTG (to 0.5mM concentration) was obtained from laboratory staff. The pellet was resuspended using ~2ml 50mM Tris-HCl pH 7.9, 1mM EDTA. The volume of this mixture (Fraction I, FR I) was recorded for later use. 100 l of FR I was stored at 4 for later use. An additional 3 ml of Tris Wash Buffer was added. The solution was centrifuged (6000 RPM, 10 min) and the supernate was discarded. The cells were resuspended in 1 ml Tris Wash Buffer/lysozyme. After allowing the cells to lyse for 15 minutes, 1 ml Tris Wash Buffer + detergents (10mM Tris-HCl pH 7.9, 50mM KCl, 1 mM EDTA, 0.1mM protease inhibitor, 0.5% Tween 20, 0.5% Triton X-100). The solution was heated for 60 minutes at 75. The solution was centrifuged at 8000 RPM for 10 minutes. The supernate was collected (Fraction II, FR II) with 25l being set aside for PCR analysis. These samples were stored at -20. PCR assay of FR I and FR II: A primer-dimer PCR assay of FR I and FR II was performed using the following components: 5’ primer, 1.0M; 3’ primer, 1.0M; dNTP’s (dATP, dCTP, dTTP, dGTP) 0.2mM each; MgCl2, 10mM; Buffer (50mM KCl, 10mM Tris, pH 8.3); and water to make volumes equal. A serial dilution (use Taq dilution buffer) was performed to give 1/20,1/40,1/80, and 1/160 dilutions of FR I and FR II. The PCR reaction was carried out with 5l each of; undiluted FR I, undiluted FR II, the 1/20, 1/40, 1/80, 1/160 dilutions of FR I and FR II, Taq polymerase positive control and water for the negative control. 20l of the master mix was added to each PCR reaction tube to bring the total volume to 25l. The PCR program for this assay was 20 cycles of 15 seconds at 85 / 15 seconds at 75. The results of the PCR assay were analyzed using a 1.2% agarose gel in 0.5X TBE buffer. 6l of loading dye + EtBr was added to each reaction tube. The gel was run at 40 mAmps for 7-10 minutes. Ion-exchange chromatography: A column was made using 4 ml 50% Diethyl aminoethyl (DEAE) – cellulose slurry in “column pouring buffer” (10mM Tris-HCl pH7.9, 50mM KCl, 1 mM EDTA). 50l of FR II were saved for a protein assay and PAGE gel analysis. 6 ml “Binding Buffer” (“column pouring buffer” + 0.1 mM protease inhibitor, 0.5% Tween 20, 0.5% Triton X-100) was added to the remaining volume of FR II. This solution was poured onto the top of the column bed. The column was washed with 5 column volumes of “Binding Buffer”, with the last 1ml of the wash being collected. The protein was eluted using a Cl- gradient (150mM Buffer B-150, 200mM B-200, and 250mM KCl B-200). 4 ml of each concentration of KCl was added and 1.3ml fractions of the elutions were collected. 3 BCA assay: 100l of each fraction of the ion-exchange chromatography was assayed for protein concentration. The following reagents were used: Reagent A – sodium carbonate, sodium bicarbonate, disodium BCA, and sodium tartrate in 0.2 N NaOH; Reagent B – 4% CuSO45H2O in deionized water; standard protein solution – Bovine Serum Albumin (BSA) at 4mg/ml of Buffer B-150; Working Reagent - 50 parts A with 1 part B. BCA assay tubes were set up as follows (Table 1). Tube # B-150 (l) Sample (l) Working reagent 1 2 100 80 0 20 0.9 ml 0.9 3 60 40 0.9 4 5 6 7 8 40 20 95 95 95 60 80 5 (FR I) 5 (FR I !/10 dil.) 5 (FR II) 0.9 0.9 0.9 0.9 0.9 Table 1. BCA assay Tubes 1-5 were used to find a standard curve for the BCA assay. Tubes 9-19 contained 100l of the column flow-through, wash, and three collected samples from B150, B-200, and B-250. The tubes were incubated at 37 for 30 minutes and the absorbance was read at 562 nm. SDS-PAGE: A PCR primer-dimer assay was performed on tubes 9 (flowthrough), 11 (B-150#1) – 19 (B250#3). Column fractions to be analyzed by SDS-PAGE were selected based upon results of the PCR primer-dimer assay and gel electrophoresis analysis. 30l samples containing 10g of protein were prepared of FR I, FR II, flowthrough, and column fractions from tubes 13-16 (FR I-26.5l, FR II-20.5l, flow through-30l, B150#3-30l, B200#1-30l, B200#2-30l, B200#3-22.5l). To each sample, 10l of 4x sample buffer was added (1x sample buffer = 10% glycerol, 0.5% mercaptoethanol, 1% SDS, 50g/ml of bromothymol blue. Samples were heated for 3 minutes in a boiling water bath. A 10% polyacrylamide gel was obtained from lab staff and a stacking gel was prepared using; ammonium persulfate, TEMED, and the stacking gel solution. 20 l of the samples and 10l of the molecular weight (MW) markers were added to the wells. Samples were electrophoresed at 35mA for about 45 minutes. Gels were stained with Coomassie Blue R-250 stain. Final PCR analysis: A primer-dimer assay was performed to find the activity of Taq polymerase in FR III (tube 13, B-150#3). FR III was diluted with Taq dilution buffer to give samples of the following dilutions; 1/5, 1/10, 1,20, 1/40, 1/80, 1/160. Amplitaq was diluted to give samples of dilutions; 1, ½, ¼, 1/8, 1/16. Results of the PCR run were analyzed by using gel electrophoresis to find the activity of FR III and Amplitaq. 4 Results The volume of Fraction I after cell lysis was found to be 3.3 ml. The volume of Fraction II after heat extraction was found to be 2.0. A primer-dimer PCR assay was performed on FR I and FR II to find the specific activity of the Taq polymerase in those two samples (Figure 1). Lane # 12 11 10 9 8 7 6 5 4 3 2 1 Figure 1. Lanes 1-5 contain Fraction I; 1-undiluted, 2-1/20, 3-1/40, 4-1/80, 5-1/160 dilutions. Lanes 6-10 contain FR II; 6-undiluted, 7-1/20, 8-1/40, 9-1/80, 10-1/160 dilutions. Lane 11 contains the positive control and 12 contains the negative control. In both FR I and FR II, 5l of a 1/160 dilution of the sample produced amplified DNA. The activity of these fractions was calculated. ( 5l)(1/160 dilution) = 1 unit of activity in 0.03125 l. ( 1l ) / ( 0.03125 l ) = 32 units / 1 l. (32 units/l)(1000l/ml) = 32000 units of Taq activity/ml for both FR I and FR II. Spectrophotometric analysis of the BCA assay gave the following results. A standard curve for the absorption of the BCA – Cu+ complex at 562 nm is shown in Figure 2. Protein Standard Curve Absorbance 0.8 0.6 y = 20.563x + 0.0284 R2 = 0.9921 Series1 0.4 Linear (Series1) 0.2 0 0 0.02 0.04 BSA concentration (m g/m L) Figure 2. BSA assay standard curve. BSA Abs. .mg/ml 562 nm 0 0 0.008 0.221 0.016 0.367 0.024 0.532 0.032 0.667 The line, y = 20.563x + 0.0284 (Abs. = y, x = protein concentration) was used to find the protein concentrations of FR I, FR II, the flow-through, wash, B-150 #1-3, B-200 5 #1-3, and B-250 #1-3. A sample calculation for FR I shows how this was done. Concentration protein = (Abs. – 0.0284)/20.563 = (0.06 – 0.0284)/20.563 = 0.0015 mgprotein/ml. Multiplying this number by the dilution factor of 181 gives the concentration of protein in the sample. (0.0015)(181) = 0.272 mg/ml or 272 g/ml. Dividing 10g/272g gives the volume (l) needed to obtain 10g of protein. For FR I, this volume was found to be 9.1 l. Table 2. Summarizes the results of the BCA assay. tube description FR 1 FR 1 1/10 dil FR II flow-through wash B-150 #1 #2 #3 B-200 #1 #2 #3 B-250 #1 #2 #3 A at 562nm C in cuvette Dil. Factor 0.06 0.0015mg/ml 0.041 0.00061 0.072 0.0021 0.423 0.019 0.106 0.0038 0.091 0.003 0.149 0.0059 0.465 0.021 0.402 0.018 0.622 0.029 0.509 0.023 0.346 0.015 0.353 0.016 0.226 0.0096 181 1810 181 10 10 10 10 10 10 10 20 40 40 40 C in sample Volume needed for 10 36.7ul 9.1 26.3 52.6 263.2 333 169.5 47.6 55.6 34.5 21.7 16.1 15.6 26.3 0.272mg/ml 1.1 0.38 0.19 0.038 0.03 0.059 0.21 0.18 0.29 0.46 0.62 0.64 0.38 Table 2. Results of BCA assay Figure 3. shows a graph of volume eluted from the column during ion-exchange chromatography vs. the protein concentration. protein concentration (mg/ml) Volume eluted from column vs. protein concentration 0.7 0.6 0.5 0.4 0.3 0.2 0.1 0 Series1 0 10 20 30 approxim ate volum e eluted (m l) Figure 3. Volume eluted during ion-exchange chromatography vs. protein concentration. 6 Values for Figure 3. volume .mg/ml 8 0.19 15 0.038 16.3 0.03 17.6 0.059 18.9 0.21 20.2 0.18 21.5 0.29 22.8 0.46 24.1 0.62 25.4 0.64 26.7 0.38 Figure 4. shows the results of the PCR assay of 10 column fractions of the DEAE ion-exchange chromatography. Lane # 1 2 3 4 5 6 7 8 9 10 11 12 Figure 4. PCR assay of DEAE column fractions. Lane 1- flow through, 2 –wash, 3-B150#1, 4- B150#2, 5B150#3, 6-B200#1, 7-B200#2, 8-B200#3, 9-B250#1, 10-B250#2, 11-positive control, 12-negative control. Lane 5,6,and 7 show Taq polymerase activity. The greatest activity is seen in lane 5, which corresponds to the B-150#3 fraction of the DEAE ion-exchange chromatography. The results of the SDS-PAGE gel can be found in Figure 5. Lane # 1 2 3 4 5 6 7 8 9 Figure 5. SDS-PAGE gel of DEAE column fractions. Lane 1 – molecular weight (MW) markers, 2-FR I, 3- FR II, 4- column flow through, 5-B150#3, 6-B200#1, 7-B200#2, 8-B200#3, 9- MW markers. The molecular weight of the Taq protein was found by linear regression analysis (using Microsoft Excel) of a plot of the Rf of the protein migration vs. the log10 of the 7 molecular weights of the marker proteins (Figure 6). The Rf value of each protein is found by dividing the distance that protein migrated (mm) by the total distance from the top of the gel to the bottom of the gel (where the dye stopped after the power supply was disconnected. Rf value protein migration SDS-PAGE gel y = -0.7378x + 3.9978 R2 = 0.9886 0.8 0.7 0.6 0.5 0.4 0.3 0.2 0.1 0 Series1 Linear (Series1) 4 4.5 5 5.5 log 10 m olecular w eight Figure 6. Rf of protein migration vs. log10 of the protein molecular weight. Log 10 MW 5.312 5.064 4.989 4.82 4.653 4.462 Rf 0.0965 0.2632 0.3158 0.4035 0.5526 0.7368 The equation, y = -0.7378x + 3.9978 (y = Rf protein migration, x = log10 molecular weight) was used to find the molecular weight of the Taq protein. MW = (Rf – 3.9978)/-0.7378. The Taq polymerase migrated 20 mm. Its Rf value is 20/57 (the dye moved a total of 57 mm through the gel. The log10MW of Taq is calculated as follows (0.3509 – 3.9978)/-0.7378 = 4.943. The MW is found by taking the antilog of this number. The molecular weight of Taq DNA polymerase is 87687 D. A final primer-dimer PCR assay was performed on Taq FR III (B-150#3 from the ion-exchange chromatography) and Amplitaq. FR III was assayed using dilutions of 1/5, 1/10, 1,20, 1/40, 1/80, 1/160. Amplitaq was assayed using dilutions of; 1, ½, ¼, 1/8 and 1/16. A picture of the agarose gel from the PCR assay is found in Figure 7. Lane # 12 11 10 9 8 7 6 5 4 3 2 1 Figure 7. Final PCR assay of FR III and Amplitaq. Lane 1 contains 1/5 diluted FR III, 2-1/10, 3-1/20, 41/40, 5-1/80, 6-1/160, 7- Amplitaq no dilution, 8-1/2, 9-1/4, 10-1/8, and Lane 12 contains 1/16 dilution of Amplitaq. 8 The units/ml of FR III was calculated in the same manner as those from FR I and FR II. It was found to be 4000units/ml. Amplitaq was found to have 800units activity/ml. This value corresponds to 0.8 units/l or 4 units/5l. This can be compared to the commercial definition of activity which states that Amplitaq has 2 units of activity per 5l. The specific activity (S.A.) of Taq from each step of the purification process was found by dividing the total units of enzyme by the total mg of protein. The fold purification of FR III was found using the following equation, fold purification FR III = S.A. FR III/S.A. FR I. The %yield of FR III was found using, %yield FR III = (total units FR III/total units FR I)100%. Table 3 summarizes the results of the Taq purification and characterization. Fraction Recorded Protein volume (mg/ml) (ml) Fraction I 3.3 Fraction II Fraction III ~1.3 Total Protein (mg) Units/ml Total Units Specific Activity units/mg Fold Purification Enzyme Yield % 0.272 1.1 (1/10 dil.) 2 0.38 0.898 3.63 32000 105600 117594 29090 1 100 0.76 32000 64000 84210 0.716 60.6 0.21 0.273 4000 5200 19048 0.162 4.9 Table 3. Purification Table for Taq Polymerase Discussion It was observed that the protein concentration of FR III (ion-exchange column fraction), 0.21 mg/ml was less than those of FR I (0.272 mg/ml or 1.1 mg/ml when the 1/10 dilution of FR I was analyzed) and FR II which was found to be 0.38 mg/ml. For FR I, the value of 1.1 mg/ml protein is more plausible because protein would have been lost during each step of the purification. FR I should have a greater protein concentration than FR II. The calculated protein concentration of the undiluted FR I being 0.272 is most likely explained by the protein being too concentrated to give an accurate reading in the BCA assay. The activity of Taq was found for each step of the purification. It was found to be 32000 for both FR I and FR II and 4000 for FR III. It is important to note that the units/ml for FR I and FR II are underestimated in this report. When a primer-dimer PCR assay was performed for these two fractions, no negative results were observed for any dilutions. There may have still been polymerase activity in further dilutions. If this is true, it would increase the observed units/ml of activity. For example, if a 1/320 dilution of FR I still displayed Taq activity, the units/ml would be 64000. It is impossible to determine how much Taq activity was lost during the heat extraction because of this fact. It stands to reason that some Taq protein was lost during the heat extraction/precipitation. FR III (B-150#3 column fraction) shows a marked drop in Taq activity as compared to FR I and FR II. It is important to note that column fractions B-200#1 and B-200#2 also showed Taq activity in the primer-dimer PCR assay. It is, however, still safe to assume that a fair amount of Taq protein was lost during the ion-exchange column chromatography. Analysis of the SDS-PAGE gel reveals the presence of Taq protein (MW = 87687 D) and a major contaminant with a molecular weight of 15207 D. This value is very close to the predicted value of Taq having a molecular weight of 91630 D. The calculated molecular weight for Taq, can be divided by 110 (#D/amino acid) to find the 9 number of amino acids in the protein. Taq was found to contain 797 amino acids. When the number of amino acids is multiplied by 3 (3codons/amino acid) we find that the gene which encodes Taq is 2391 base pairs in length. The known length of the Taq gene is 2499 base pairs. The experimental error was found to be 4.32% ([2499 – 2391]/2499)100%. The 15207 D protein is observed in FR I and to a greater extent in FR II. It is also observed in increasing amounts in column fractions B-200#1, B-200#2 and B-200#3. SDS-PAGE analysis reveals that column fraction B-150#3 (FR III) contained the most pure concentration of Taq protein. FR I shows a number of bands from about 100000 D all the way down to 29000 D. This shows that FR I contained many different proteins in solution. FR II (the heat extract) showed a very visible band of Taq and some low molecular weight proteins. These low molecular weight proteins may be protein fragments. FR II contained Taq protein that was much more pure than FR I. FR III had the most pure Taq. There was also a significant drop in the activity of this sample. Quantity of the enzyme was sacrificed for purity. It could be argued that the ion-exchange chromatography caused too great a loss of enzyme activity. Fraction II (the heat extract) contained Taq enzyme which was much more pure than the crude cell extract. The specific activity of FR II was 84210 units/mg compared to 29090 units/mg for FR I (using the 1/10 dilution calculation that FR II contains 1.1 mg/ml of protein. The specific activity of FR III drops down to 19048 units/mg. The additional purity that is gained during ion-exchange chromatography may not be worth the additional time this purification step requires and the loss of enzyme activity it causes. To produce Taq in a more efficient manner, I would propose that the ionexchange chromatography be left out of the protocol. The only purification step would be to do a heat extraction. By using large culture vats, great amounts of Taq protein could be produced and purified in a short period of time with a very low expenditure. Literature Cited Fuchs, J. 1999. Biochemistry 5025 Laboratory Manual. University of Minnesota. Mueller, N. 1999. Purification and Characterization of Plasmid DNA. BioC 5025 assignment. Stryer, L. Biochemistry. 4th Edition. New York: W.H. Freeman and Company, 1995: 45. 10
