Answer KEY
advertisement
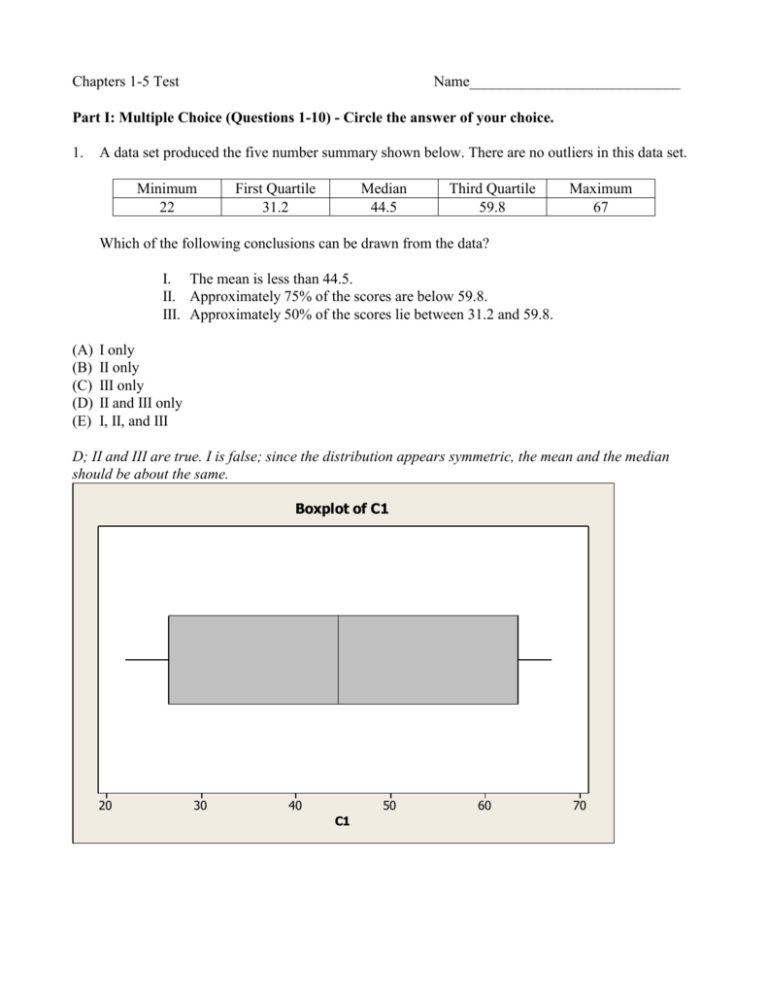
Chapters 1-5 Test Name____________________________ Part I: Multiple Choice (Questions 1-10) - Circle the answer of your choice. 1. A data set produced the five number summary shown below. There are no outliers in this data set. Minimum 22 First Quartile 31.2 Median 44.5 Third Quartile 59.8 Maximum 67 Which of the following conclusions can be drawn from the data? I. The mean is less than 44.5. II. Approximately 75% of the scores are below 59.8. III. Approximately 50% of the scores lie between 31.2 and 59.8. (A) (B) (C) (D) (E) I only II only III only II and III only I, II, and III D; II and III are true. I is false; since the distribution appears symmetric, the mean and the median should be about the same. Boxplot of C1 20 30 40 50 C1 60 70 2. The following is an ogive on the number of ounces of alcohol (one ounce is about 30 mL) consumed per week in a sample of 150 students. A study wished to classify the students as “light”, “moderate”, “heavy” and “problem” drinkers by the amount consumed per week. About what percentage of students are moderate drinkers, that is consume between 4 and 8 ounces per week? (A) (B) (C) (D) (E) 60% 20% 40% 80% 50% C; 60 20 40 3. A small company employs a supervisor at $1200 a week, an inventory manager at $800 a week, 6 stock boys at $400 a week, and 4 drivers at $700 a week. Which measure of spread, would best describe the payroll, the range, the IQR, or the standard deviation? (A) (B) (C) (D) (E) Range, because it would be least sensitive to the outlier at $1200. Standard deviation, because it would be least sensitive to the outlier at $1200. IQR, because it would be least sensitive to the outlier at $1200. IQR, because it would be least sensitive to the outliers at $800 and $1200. IQR, because the distribution is symmetric. C; 4. A set of data has the following five number summary: Minimum 17 First Quartile 27 Median 40 Third Quartile 49 Maximum 90 Which of the following contains all the outliers in the distribution? (A) (B) (C) (D) (E) 75, 80, 85 78, 80, 85, 90 83, 85, 90 2, 3, 85, 90 0, 80, 84, 89 C; 1.5 49 27 1.5 22 33 ; 27 33 6 , so there are no lower outliers. 49 33 82 , so any numbers above 82 can be considered outliers. 5. A business owner recorded her annual profits for the first 12 years since opening her business. The stem-and-leaf display below shows the annual profits in thousands of dollars. Describe the distribution (shape, center, spread, unusual features). (A) The distribution of the business owner's profits is skewed to the right, and is unimodal, with gaps in between. The center is at around $120,000. (B) The distribution of the business owner's profits is skewed to the left, and is multimodal, with gaps in between. Five years the business had profits near $150,000, another four years the business had profits near $120,000, and three years the business had profits near $90,000. (C) The distribution of the business owner's profits is skewed to the right, and is multimodal, with gaps in between. Five years the business had profits near $150,000, another four years the business had profits near $120,000, and three years the business had profits near $90,000. (D) The distribution of the business owner's profits is skewed to the left, and is multimodal, with gaps in between. Five years the business had profits near $140,000, another four years the business had profits near $110,000, and three years the business had profits near $80,000. (E) The distribution of the business owner's profits is skewed to the left, and is unimodal, with gaps in between. The center is at around $120,000. B; 6. If we want to discuss any gaps and clusters in a data set, which of the following should not be chosen to display the data set? (A) (B) (C) (D) (E) histogram stem-and-leaf plot boxplot dotplot any of these would work C; 7. We might choose to display data with a stemplot rather than a boxplot because a stemplot I. reveals the shape of the distribution. II. is better for large data sets. III. displays the actual data. (A) (B) (C) (D) (E) I only II only III only I and III I, II, and III D; I and III are true; II is false because a stemplot shows individual data points which can be problematic with very large data sets. 8. The weights of the male and female students in a class are summarized in the following boxplots: Which of the following is NOT correct? (A) (B) (C) (D) (E) About 50% of the male students have weights between 150 and 185 pounds. About 25% of female students have weights more than 130 pounds. The median weight of male students is about 162 pounds. The mean weight of female students is about 120 pounds because of symmetry. The male students have less variability than the female students. E; the males have more variability than the females. 9. In 2008 the U.S. Census Bureau published Public Education Finances, reporting the average amount (dollars per student) spent by public schools in each state during the 2006 school year. Many Eastern States spent in excess of $12,000 per student, including the maximum of $14884 per student in New York. Utah spent the least, $5437 per student. Georgia spent $8565 per student. What measure of center and spread would be most appropriate to describe the distribution? (A) (B) (C) (D) (E) Mean and standard deviation; the data are mound and symmetric Mean and standard deviation; the data are skewed right Median and IQR; the data are mound and symmetric Median and IQR; the data are skewed right Median and IQR; the data are skewed left D; 10. Which of the following summaries are changed by adding a constant to each data value? I. the mean II. the median III. the standard deviation (A) (B) (C) (D) (E) I only III only I and II I and III I, II, and III C; I and II are true; III is false-if you increase each value in a data set, the spread will increase as well. Part II: Free Response (Questions 11-13) – Show your work and explain your results clearly. 11. In a 1980 study, researchers looked at the relationship between the type of college (public or private) attended by 3585 members of the class of 1960 who went into industry and the level of job each member had in 1980. The results were: Management Level High Middle Low Public 75 (4.2%) 962 (54.4%) 732 (41.4%) 1769 Private 227 (12.5%) 994 (54.7%) 595 (32.8)% 1816 (a) Compute the marginal counts for the type of college. Write the numbers above. (b) Compute the conditional distributions of management level given college type (in percents). Write the percents next to the counts in the above table. Use the conditional distribution to make a segmented bar chart comparing the management level of public and private class members. (c) Briefly comment on the segmented bar chart comparing the management level of the public and private class members. The private college members were much more likely to be high level managers and less likely to be low level managers. The percentage of middle level managers was about the same for each of the college types. 12. A set of 91 scores has the following frequencies and resulting histogram. For example, 1 person scored a 7, 5 scored a 9, and so on. Score Frequency 7 1 8 0 9 5 10 0 11 8 12 18 13 5 14 3 15 18 Score Frequency 16 17 17 4 18 3 19 3 20 2 21 2 22 0 23 1 24 1 (a) Draw a boxplot of the data showing outliers if they exist. (b) What feature(s) does the histogram show that is missed by the boxplot? The distribution is bimodal. There are also gaps. (c) What feature(s) is more clearly distinguished in the boxplot than in the histogram? The outliers are clearly indicated (this is not the case with the histogram; the extreme values are only potential outliers until they have been verified). 13. A guitar player from Athens, Georgia decides to purchase a new Fender Stratocaster. He visits two large retail guitar stores and records the prices of 15 guitars at each store. Dot Plots and summary statistics of his observations are shown below. (a) Determine the upper and lower fences for outliers for each distribution and circle any outliers on the plots. For GC: The IQR is 700 450 250 . So, 1.5 250 375 . Q1 375 450 375 75 Q3 375 700 375 1075 For SG: The IQR is 700 350 350 . So, 1.5 350 525 . Q1 375 450 525 75 Q3 375 700 525 1225 GC has two outliers on the upper end and SG has one outlier. (b) What would be the most appropriate measures of center and spread for comparing the prices of the two stores? Explain. The median and the IQR; since the distributions are skewed to the right. The median is resistant to outliers and skewness.

