Motor & Sensory Assessment Report: PDMS-2, MAP, BOT-2
advertisement
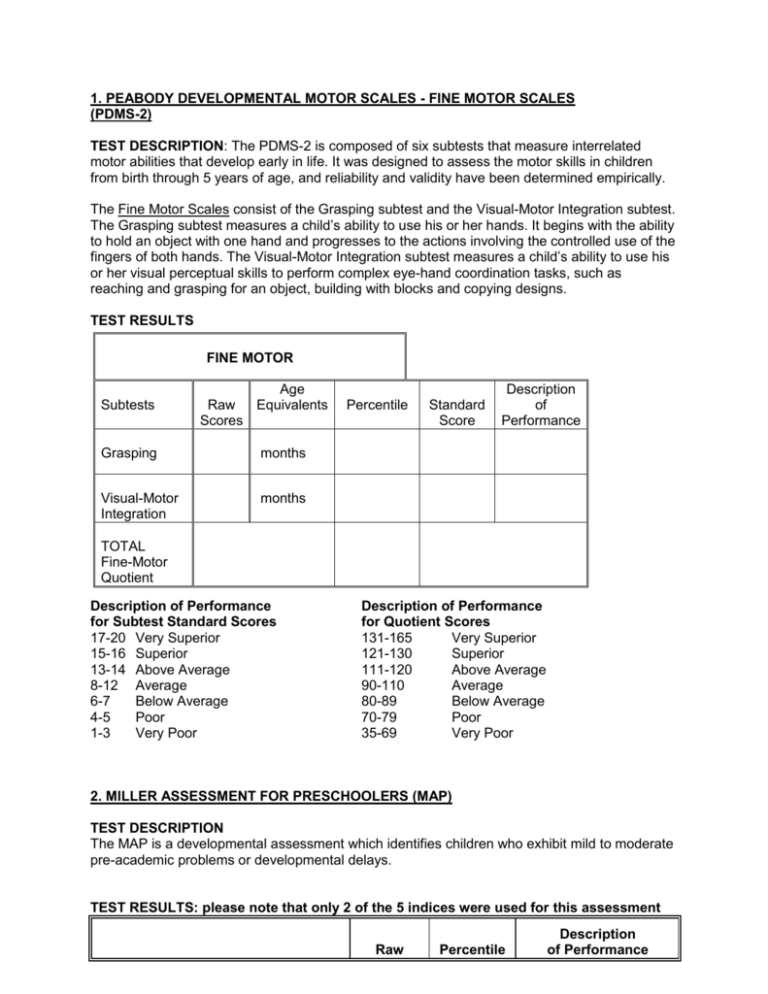
1. PEABODY DEVELOPMENTAL MOTOR SCALES - FINE MOTOR SCALES (PDMS-2) TEST DESCRIPTION: The PDMS-2 is composed of six subtests that measure interrelated motor abilities that develop early in life. It was designed to assess the motor skills in children from birth through 5 years of age, and reliability and validity have been determined empirically. The Fine Motor Scales consist of the Grasping subtest and the Visual-Motor Integration subtest. The Grasping subtest measures a child’s ability to use his or her hands. It begins with the ability to hold an object with one hand and progresses to the actions involving the controlled use of the fingers of both hands. The Visual-Motor Integration subtest measures a child’s ability to use his or her visual perceptual skills to perform complex eye-hand coordination tasks, such as reaching and grasping for an object, building with blocks and copying designs. TEST RESULTS FINE MOTOR Subtests Age Raw Equivalents Scores Grasping months Visual-Motor Integration months Percentile Standard Score Description of Performance TOTAL Fine-Motor Quotient Description of Performance for Subtest Standard Scores 17-20 Very Superior 15-16 Superior 13-14 Above Average 8-12 Average 6-7 Below Average 4-5 Poor 1-3 Very Poor Description of Performance for Quotient Scores 131-165 Very Superior 121-130 Superior 111-120 Above Average 90-110 Average 80-89 Below Average 70-79 Poor 35-69 Very Poor 2. MILLER ASSESSMENT FOR PRESCHOOLERS (MAP) TEST DESCRIPTION The MAP is a developmental assessment which identifies children who exhibit mild to moderate pre-academic problems or developmental delays. TEST RESULTS: please note that only 2 of the 5 indices were used for this assessment Raw Percentile Description of Performance Performance Indices Score 4. Non-verbal Index (Visual perceptual abilities with minimal motor components) #R: #Y: 5. Complex Tasks Index (Visual spatial activities with a motor #R: #Y: Score (see below) Description of Performance for Percentile Score Scores above 25 - within normal limits Scores between 6-25 - appears to need monitoring Scores below 6 - appears to need further evaluation or remedial input 3. SENSORY PROFILE (DUNN, 1999.) TEST DESCRIPTION: A caregiver questionnaire that asks the rater to indicate the frequency of the child’s responses to sensory experiences. Sensory Processing Section Raw Score Total /40 /45 /55 /90 /35 /60 Typical Performance 40 ---------- 30 45 ---------- 32 55 ---------- 48 90 ---------- 73 35 ---------- 27 60 ---------- 46 Probable Difference 29 ----------- 26 31 ----------- 27 47 ----------- 45 72 ----------- 65 26 ----------- 24 45 ----------- 40 Definite Difference 25 --------×--- 8 26 --×--------- 9 44 --×---------11 64 ----×-------18 23 ------×------7 39 --×-------- 12 /45 45 ---------- 39 38 ----------- 36 35 -×---------- 9 /50 50 ---------- 41 40 ----------- 36 35 ----×------ 10 /35 35 --------× 23 22 ----------- 19 18 ------------- 7 /20 20 ---------- 16 15 ------------14 13 -----------× 4 /20 20 -----------15 14 ---------× 12 11 ------------- 4 /85 85 ---------- 63 62 ----------- 55 54 -----×------17 /30 30 ---------- 22 21----------- 19 18 --×--------- 6 /15 15 ---------- 12 11 ----------- 10 9 -×------------ 3 A. Auditory Processing B. Visual Processing C. Vestibular Processing D. Touch Processing E. Multisensory Processing F. Oral Sensory Processing Modulation G. Sensory Processing Related to Endurance/Tone H. Modulation Related to Body Position and Movement I. Modulation of Movement Affecting Activity Level J. Modulation of Sensory Input Affecting Emotional Responses K. Modulation of Visual Input Affecting Emotional Responses & Activity Level Behaviour & Emotional Responses L. Emotional/Social Responses M. Behavioural Outcomes of Sensory Processing N. Items Indicating Thresholds for Response FACTOR 1. Sensory Seeking 2. Emotionally Reactive 3. Low Endurance/Tone 4. Oral Sensory/Sensitivity 5. Inattention/Distractibility 6. Poor Registration Factor Raw Score Total /85 /80 /45 /45 /35 /40 Typical Performance 85 --------------- 63 80 --------------- 57 45 --------------- 39 45 --------------- 33 35 --------------- 25 40 --------------- 33 Probable Difference 62 -------------- 55 56 -------------- 48 38 -------------- 36 32 -----------×- 27 24 -------------- 22 32 -------------- 30 Definite Difference 54 ---×-------- 17 47 ---------×---16 35 --×----------- 9 26 -------------- 9 21 -----------×-- 7 29 -×------------ 8 7. Sensory Sensitivity 8. Sedentary 9. Fine Motor/Perceptual /20 /20 /15 20 --------------- 16 20 ×------------- 12 15 --------------- 10 15 -------------- 14 11 -------------- 10 9 ----------------- 8 13 ----×-------- 4 9 ---------------- 4 7 ×---------------3 4. SHORT SENSORY PROFILE Test Description: A short caregiver questionnaire that measures sensory modulation during daily life. SECTION Tactile Sensitivity Taste/Smell Sensitivity Movement Sensitivity Underresponsive/Seeks Sensation Auditory Filtering Low Energy/Weak Visual/Auditory Sensitivity Total Section Raw Score Total 31/45 14/20 14/15 24/35 26/30 30/30 20/25 159/190 Typical Performance 35----------×--30 20--------------15 15------×------13 Probable Difference 29--------------27 14×-------------12 12--------------11 Definite Difference 26---------------7 11---------------4 10---------------3 35--------------27 26-------------×24 30--------×----23 22--------------20 30×------------26 25--------------24 23---------------7 19---------------6 23---------------6 25----------×--19 190--------×155 15---------------5 141------------38 18--------------16 154-----------142 4. BEERY/BUKTENICA DEVELOPMENTAL TESTS OF VISUAL MOTOR INTEGRATION (VMI), VISUAL PERCEPTION & MOTOR COORDINATION. TEST DESCRIPTION: The VMI assesses a child's ability to use his/her eyes (visual) and hands (motor) together to copy progressively more difficult geometric forms on paper with a pencil. The tasks on the VMI test involve many skills that are thought to be related to pre-printing and printing abilities. The visual perception subtest allows the child to match shapes without a motor component. The motor coordination subtest allows the child to trace shapes with limited visual perception requirements. TEST RESULTS Raw Score Standard Score Scaled Score Percentile Performance VMI Visual Perception Motor Coordination Description of Performance for Standard Score >129 Very High 120-129 High 110-119 Above Average Age Equivalent 90-109 80-89 70-79 <70 Average Below Average Low Very Low 5. BRUININKS-OSERETSKY TEST OF MOTOR PROFICIENCY TEST DESCRIPTION The Bruininks-Oseretsky Test of Motor Proficiency assesses gross and fine motor abilities. Only the fine motor portion was used for this assessment. TEST RESULTS Point Score Subtests Subtest Standard Score Description of Performance (see below) Fine Motor Subtests Response Speed Visual Motor Control Upper Limb Speed & Dexterity FINE MOTOR COMPOSITE Sum = Composite Standard Score= Percentile Rank = Description of Performance for Subtest Standard Score ------------------------------------------------21-25 - above average 10-20 - average 5-9 - below average 0-4 - well below average Description of Performance for Composite Standard Score --------------------------------------------------------61-70 - above average 40-60 - average 30-39 - below average 20-29 - well below average 6a). BRUININKS-OSERETSKY TEST OF MOTOR PROFICIENCY- 2ND EDITION TEST DESCRIPTION: The Bruininks-Oseretsky Test of Motor Proficiency, 2nd edition (BOT-2) is a measure of fine and gross motor control skills. It consists of four motor-area composites. The fine motor composites of Fine Manual Control and Manual Coordination were used in this Occupational Therapy assessment. Fine Manual Control assesses motor skills involved in writing and drawing, which require a relatively high degree of precision. Manual Coordination assesses motor skills involved in reaching, grasping, and manipulating objects, with an emphasis on speed, dexterity, and coordination of arms and hands. TEST RESULTS Total Point Score Scaled Score Standard Score Percentile Rank Age Equivalent Descriptive Category Fine Motor Precision Fine Motor Integration Fine Manual Control Composite Manual Dexterity Sum = Upper-Limb Coordination Manual Coordination Composite Sum = Descriptive Category Well-Above Average Above Average Average Below Average Well-Below Average Scale Score Range 25 or greater 20-24 11-19 6-10 5 or less Standard Score Range 70 or greater 60-69 41-59 31-40 30 or less Percentile Rank Range 98 or greater 84-97 18-83 3-17 2 or less 6b). BRUININKS-OSERETSKY TEST OF MOTOR PROFICIENCY- 2ND EDITION TEST DESCRIPTION: The Bruininks-Oseretsky Test of Motor Proficiency, 2nd edition (BOT-2) is a measure of fine and gross motor control skills. It consists of four motor-area composites. a) Fine Manual Control assesses motor skills involved in writing and drawing, which require a relatively high degree of precision. b) Manual Coordination assesses motor skills involved in reaching, grasping, and manipulating objects, with an emphasis on speed, dexterity, and coordination of arms and hands. c) Body Coordination encompasses control and coordination of the large musculature that aids in maintaining posture and balance. d) Strength and Agility encompasses control and coordination of the large musculature involved in locomotion, especially recreational and competitive sports. TEST RESULTS Total Point Score Scaled Score Standard Score Percentile Rank Age Equivalent Descriptive Category Fine Motor Precision Fine Motor Integration Fine Manual Control Composite Manual Dexterity Sum = Upper-Limb Coordination Manual Coordination Composite Bilateral Coordination Sum = Balance Body Coordination Sum = Running Speed & Agility Strength Strength & Agility Descriptive Category Well-Above Average Above Average Average Below Average Well-Below Average Sum = Scale Score Range 25 or greater 20-24 11-19 6-10 5 or less Standard Score Range 70 or greater 60-69 41-59 31-40 30 or less Percentile Rank Range 98 or greater 84-97 18-83 3-17 2 or less 7. MOTOR-FREE VISUAL PERCEPTUAL TEST, 3rd Edition (MVPT-3) TEST DESCRIPTION Motor Free Visual Perceptual Test, 3rd edition, assesses an individual’s visual perceptual ability without any motor involvement required to make a response, i.e. use of hands. It is designed for screening, diagnostic, and research purposes. Areas assessed include: Spatial Relationships: the ability to identify a form that is oriented in a different direction from other similar forms. Visual Discrimination: Figure Ground: Visual Closure: Visual Memory: the ability to identify a dissimilar form from among similar forms. the ability to distinguish a form from its background. the ability to identify incomplete figures when only fragments are presented. the ability to immediately remember a form or a series of forms and identify it from among similar forms. TEST RESULTS Raw Score Standard Score Percentile Rank Age Equivalent Performance Range Description of Scores Verbal Description Range of Standard Scores Very Superior 130 and above Superior 120-129 High Average 110-119 Average 90-109 Low Average 80-89 Low 70-79 Very Low 69 and below Range of Percentile Ranks 98 and above 91-97 75-90 25-74 9-24 2-8 2 and below Percentage in Population 2 7 16 50 16 7 2 8. GARDENER TEST OF HANDWRITING SKILLS TEST DESCRIPTION The Gardener Test of Handwriting assesses handwriting ability and compares it to other children of the same age. It measures how the child writes letters, words, sentences and numbers, either spontaneously, from dictation or by copying. In this case, only 3 subtests were completed, so overall scores cannot be calculated. TEST RESULTS Subtest Raw Scores Standard Scores Scaled Scores Percentile Rank Stanine 1-capital alphabet 2-lowercase alphabet 5-dictated numbers Description of Performance for Standard Scores 116-130: Above average 85-115: Average 70-84: Below Average <69: Well Below Average Description of Performance 9. FIRST ASSESSMENT OF THE SCREENING TEST AND ACADEMIC RECORD (F.A.S.T.A.R.) TEST DESCRIPTION: The F.A.S.T.A.R. is a timed test which compares printing/writing speed and skill to children of the same age. There are 8 visual-motor subtests in total. TEST RESULTS Visual Motor Subtests Alphabet from memory Copying the AlphabetPrinting Lowercase Copying the AlphabetPrinting Uppercase Copying a Paragraph – Printing Raw Score (point score) z-score Description of Performance (see below) Average Average Below Average/Average Average Below Average Below Average Below Average Below Average 1 minute: 2 minutes: 3 minutes: 4 minutes: Copying Numerals Description of Performance for z-score +1.00 to +2.00 - above average -1.00 to +1.00 - average -1.00 to -2.00 - below average -2.00 to -3.00 - well below average -3.00 to -4.00 - low 10. DEVELOPMENTAL TEST OF VISUAL PERCEPTION (2ND EDITION) TEST DESCRIPTION: A battery of eight subtests that measure different but interrelated visual perceptual and visual-motor abilities. Eye-Hand Coordination: measures the ability to draw precise straight or curved lines in accordance with visual boundaries. Position in Space: measures the ability to match two figures according to their common features. Copying: measures the ability to recognize the features of a design and to draw it from a model. Figure-Ground: measures the ability to see specified figures even when they are hidden in confusing, complex backgrounds. Spatial Relations: measures the ability to connect dots to reproduce visually presented patterns. Visual Closure: measures the ability to recognize a stimulus figure when it has been incompletely drawn. Visual-Motor Speed: measures the rapidity with which a child can make certain marks in certain designs. Form Constancy: measures the ability to match two figures that vary on one or more discriminating features (i.e., size, position, or shade). TEST RESULTS Subtests Eye Hand Coordination Raw Score Standard Score Percentile Age Equivalent yrs, mths Description of Performance Position in Space Copying Figure-Ground Spatial Relations Visual Closure Visual-Motor Speed Form Constancy yrs, mths yrs, mths yrs, mths yrs, mths yrs, mths yrs, mths yrs, mths General Visual Perception Quotient: ( ); percentile; Age Equiv.= Motor-Reduced Visual Perception Quotient: ( ); percentile; Age Equiv.= Visual-Motor Integration Quotient: ( ); percentile; Age Equivalent= Subtest Standard Scores 17-20 Very Superior 15-16 Superior 13-14 Above Average 8-12 Average 6-7 Below Average 4-5 Poor 1-3 Very Poor Composite Quotients >130 Very Superior 121-130 Superior 111-120 Above Average 90-110 Average 80-89 Below Average 70-79 Poor <70 Very Poor 11. PURDUE PEGBOARD TEST DESCRIPTION The Purdue Pegboard test was administered to assess hand speed and dexterity involved in the manipulation of small objects, using one hand at a time and using both hands together in various peg placement tasks. TEST RESULTS Hands Used Right Raw Score Standard Score Description of Performance (see below) SD below the mean of (+/____) Left SD below the mean of (+/____) Both SD below the mean of (+/___) Assembly SD below the mean of (+/___) Description of Performance for Purdue Standard Scores Performance Age (Optional) +1.00 to +2.00 - above average -1.00 to +1.00 - average -1.00 to -2.00 - below average -2.00 to -3.00 - well below average -3.00 to -4.00 - low 12. TEST OF VISUAL PERCEPTUAL SKILLS - NON MOTOR (T.V.P.S.) TEST DESCRIPTION The Test of Visual Perceptual Skills - (non-motor) - assesses the ability to perceive and interpret visual information without requiring a motor action, i.e. use of hands. These visual perceptual skills include: Visual Discrimination - the ability to identify a dissimilar form from among similar forms Visual Memory - the ability to immediately remember a form and identify it from among similar forms Visual Spatial - the ability to identify a form that is oriented in a different direction from other similar forms Visual Form Constancy - the ability to identify a form from among similar forms even though it may be smaller, larger, rotated or reversed Visual Sequential Memory - the ability to immediately remember a series of forms shown from among similar forms Visual Figure Ground - the ability to distinguish a form from its background Visual Closure - the ability to identify incomplete figures when only fragments are presented TEST RESULTS Visual Motor Subtests Raw Score (point score) Scaled Scores Description of Performance (see below) 1. Visual Discrimination 2. Visual Memory 3. Visual-spatial Relation 4. Visual Form Constancy 5. Visual Sequential Memory 6. Visual Figure-Ground 7. Visual Closure PERCEPTUAL QUOTIENT Description of Performance for Subtest Scaled Score 14-16 - above average Description of Performance for Perceptual Quotient Standard Score 116-130 - above average 7-13 - average 4-6 - below average 1-3 - well below average 85-115 - average 70- 84 - below average <69 - well below average 13. PEDIATRIC VISUAL MOTOR INTEGRATION ASSESSMENT (PVMIA) TEST DESCRIPTION: The PVMIA consists of two subtests: the drawing subtest and the block patterns subtest, and two behaviour checklists. Visual motor integration is operationally defined as the ability of a child to reproduce what he or she sees. The Drawing Subtest requires copying eight line drawings of increasing levels of complexity. The Block Patterns Subtest requires the child to copy designs of blocks using parquetry blocks, which are less familiar to preschoolers than are the traditional one-inch cubes. TEST RESULTS Drawing Subtest Raw Score Standard Score Stanine Percentile Range 57 64 8 89-95 Block Patterns Subtest 31 52 5 40-59 Combined Total 88 62 7 77-78

