here - maccinfo.com
advertisement
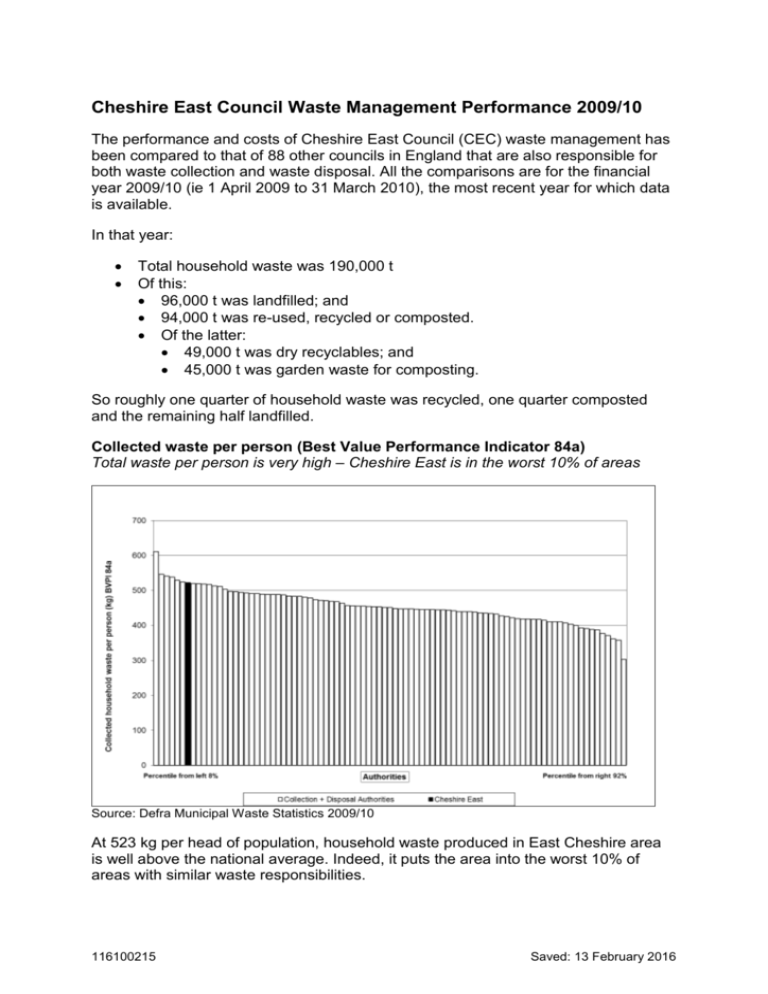
Cheshire East Council Waste Management Performance 2009/10 The performance and costs of Cheshire East Council (CEC) waste management has been compared to that of 88 other councils in England that are also responsible for both waste collection and waste disposal. All the comparisons are for the financial year 2009/10 (ie 1 April 2009 to 31 March 2010), the most recent year for which data is available. In that year: Total household waste was 190,000 t Of this: 96,000 t was landfilled; and 94,000 t was re-used, recycled or composted. Of the latter: 49,000 t was dry recyclables; and 45,000 t was garden waste for composting. So roughly one quarter of household waste was recycled, one quarter composted and the remaining half landfilled. Collected waste per person (Best Value Performance Indicator 84a) Total waste per person is very high – Cheshire East is in the worst 10% of areas Source: Defra Municipal Waste Statistics 2009/10 At 523 kg per head of population, household waste produced in East Cheshire area is well above the national average. Indeed, it puts the area into the worst 10% of areas with similar waste responsibilities. 116100215 Saved: 13 February 2016 Cheshire East Waste Management Performance and Costs Collected waste per person correlated with deprivation More affluent (less deprived) areas produce more waste – but Cheshire East is even above the trend line Sources: Defra Municipal Waste Statistics 2009/10 and IMD 2010 from CLG It has been known for several years that households with higher incomes generate more waste. The chart above plots waste per person against the Index of Multiple Deprivation (IMD) 2010. IMD combines measures of economic, health and other aspects of social well-being to give an overall score for 32,000 communities in England; the data relates to summer 2008. These scores are then averaged for each local authority area. A higher score means greater deprivation. The trend line for the 2009/10 waste produced per person confirms the correlation. And Cheshire East produces even higher amounts of waste than the trend line would predict, given the area’s deprivation (or rather lack of it). The Council has only a limited influence over this measure – but can do some things to encourage householders to produce less waste for disposal (encouraging home composting, and use of re-usable nappies, for example). Page 2 of 11 Cheshire East Waste Management Performance and Costs Residual household waste per household – National Indicator (NI) 191 Relatively less waste is collected in the residual waste stream (the black bins in the former Macclesfield area): Cheshire East is in the best 25% of areas Source: Defra Municipal Waste Statistics 2009/10 On average, each household produces 581 kg (0.6 tonne) residual waste per year. (Note that the previous measure, BVPI 84a, compared waste per head of population, not per household. The number of people per household varies between districts – from 2.1 to 2.7; Cheshire East is close to the average at 2.4.) Page 3 of 11 Cheshire East Waste Management Performance and Costs Residual household waste per household – NI 191 and IMD There is little correlation between affluence/deprivation and the amount of residual waste produced Sources: Defra Municipal Waste Statistics 2009/10 and IMD 2010 from CLG There is a weak relationship between residual waste produced and deprivation – poorer households tend to put more into the residual waste stream (“black bins”). Cheshire East is on the good side of even this weak relationship. Page 4 of 11 Cheshire East Waste Management Performance and Costs % of household waste sent for reuse, recycling and composting – NI 192 The proportion of waste sent for re-use, recycling and composting is very good – putting the area in the best 10% Source: Defra Municipal Waste Statistics 2009/10 A total of 49% of household waste was sent for re-use, recycling and composting in 2009/10. This is good in comparison to other English councils – it puts the area amongst the best 10% of councils responsible for both waste collection and waste disposal. Page 5 of 11 Cheshire East Waste Management Performance and Costs Percentage of household waste sent for reuse/recycling/composting versus deprivation Cheshire East’s proportion of recycled is even higher than the IMD would predict Sources: Defra Municipal Waste Statistics 2009/10 and IMD 2010 from CLG There is a correlation between affluence and recycling: on average the most affluent areas recycle half as much waste again as the least affluent – 45% versus 30%. Cheshire East does even better, with a rate some 8 percentage points above the best fit trend line. Page 6 of 11 Cheshire East Waste Management Performance and Costs Percentage of municipal waste landfilled – NI 193 The proportion of municipal waste landfilled is a little better than average Source: Defra Municipal Waste Statistics 2009/10 Municipal waste includes household waste and some trade waste collected by the council. At 47%, the proportion landfilled is a little lower (and therefore better) than the majority of waste collection and disposal authorities. In the chart above those councils with less than 30% landfilled use incineration for disposal, as well as landfilling. Cost of waste management For 2009/10 the costs in Cheshire East were as follows. Component Minimisation Cost per head Total cost £1 £0.3m £23 £8.1m £0 £0.1m Recycling £15 £5.3m Disposal £35 £12.5m Total £73 £26.3m Collection Trade waste Source: Audit Commission Value for Money Profile Tool 2009/10 Page 7 of 11 Cheshire East Waste Management Performance and Costs Waste disposal is the biggest element of the total costs – and is set to rise further as Landfill Tax continues to rise and landfill gate fees rise with increased engineering costs. Trade waste services should generate a break-even or small profit. Cost of waste collection per head of population At £23 per head the cost is just above average Source: Audit Commission Value for Money Profile Tool 2009/10 Page 8 of 11 Cheshire East Waste Management Performance and Costs Cost of waste disposal per head of population At £35 per head the cost is above average for councils with the same waste roles Source: Audit Commission Value for Money Profile Tool 2009/10 Cost of recycling per head of population At £15 per head the cost is well above average – but the cost breakdown may be erroneous in other councils’ cost returns Source: Audit Commission Value for Money Profile Tool 2009/10 Page 9 of 11 Cheshire East Waste Management Performance and Costs Cost of waste minimisation programmes per head of population At 80p per head the cost is above average – but many councils’ spend nothing, and total waste in Cheshire East is well above average Source: Audit Commission Value for Money Profile Tool 2009/10 Total cost of waste management per head of population At £73 per head, CEC’s cost is almost in the highest (worst) quarter of councils Source: Audit Commission Value for Money Profile Tool 2009/10 Page 10 of 11 Cheshire East Waste Management Performance and Costs The total outturn cost, per head of population, of waste management in CEC is above average (median). The difference is about £6 per head or £2m total cost. If the council could reduce its costs to those of the cheapest 25% of councils, it would save about £4m a year. Sources 1. Municipal Waste Statistics 2009/10, Statistical Release 192/10, 4 November 2010. http://www.defra.gov.uk/evidence/statistics/environment/wastats/bulletin10.htm 2. WasteDataFlow http://www.wastedataflow.org/home.aspx 3. Audit Commission Value for Money Profile Tool 2009/10 http://vfm.auditcommission.gov.uk/RenderReport.aspx?Gkey=282VqIaaVSLhf8izWEP0TODL6g ywy9mlA6o%2bD1QFon2tve0r3eeIWw%3d%3d 4. Index of Multiple Deprivation 2010: LA Summaries, CLG, March 2011 http://www.communities.gov.uk/publications/corporate/statistics/indices2010?view =Standard John Tomlinson. Mob 07968 370601 V2 28 April 2011 Page 11 of 11
