3 M - Sort Your Recycling - Plan and Pics
advertisement
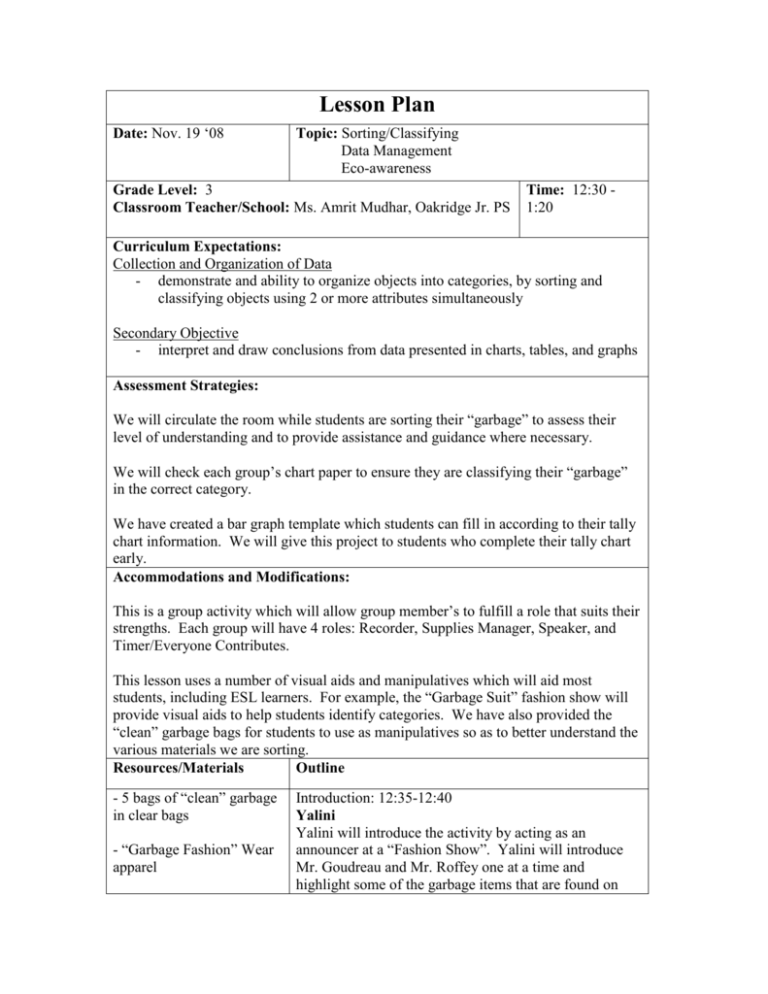
Lesson Plan Date: Nov. 19 ‘08 Topic: Sorting/Classifying Data Management Eco-awareness Grade Level: 3 Classroom Teacher/School: Ms. Amrit Mudhar, Oakridge Jr. PS Time: 12:30 1:20 Curriculum Expectations: Collection and Organization of Data - demonstrate and ability to organize objects into categories, by sorting and classifying objects using 2 or more attributes simultaneously Secondary Objective - interpret and draw conclusions from data presented in charts, tables, and graphs Assessment Strategies: We will circulate the room while students are sorting their “garbage” to assess their level of understanding and to provide assistance and guidance where necessary. We will check each group’s chart paper to ensure they are classifying their “garbage” in the correct category. We have created a bar graph template which students can fill in according to their tally chart information. We will give this project to students who complete their tally chart early. Accommodations and Modifications: This is a group activity which will allow group member’s to fulfill a role that suits their strengths. Each group will have 4 roles: Recorder, Supplies Manager, Speaker, and Timer/Everyone Contributes. This lesson uses a number of visual aids and manipulatives which will aid most students, including ESL learners. For example, the “Garbage Suit” fashion show will provide visual aids to help students identify categories. We have also provided the “clean” garbage bags for students to use as manipulatives so as to better understand the various materials we are sorting. Resources/Materials Outline - 5 bags of “clean” garbage in clear bags - “Garbage Fashion” Wear apparel Introduction: 12:35-12:40 Yalini Yalini will introduce the activity by acting as an announcer at a “Fashion Show”. Yalini will introduce Mr. Goudreau and Mr. Roffey one at a time and highlight some of the garbage items that are found on - 5 half sheets of chart paper their clothing. Mr. Roffey and Mr. Goudreau will act like runway models. - markers Middle: 12:40 – 12:50 Dan and Yalini Dan and Yalini will use guiding questions to have students identify the various materials found on Mr. Roffey and Mr. Goudreau’s clothing. The categories are: Glass, Plastic, Paper, Metal, Garbage After determining the categories, Dan and Yalini will lead a group sorting activity. We will create a tally chart to sort all the materials found on the “fashion model’s” clothing. We will review how tally chart’s are created and why we group tally marks in group’s of 5. Ramie Ramie will then introduce the activity. Each group will receive 1 bag of “garbage”. The objective is to create a tally chart using the same categories we have just outlined to tally and sort the items in each bag. Ramie will outline the group positions: Recorder, Supplies Manager, Speaker, and Timer/ Everyone Contributes. Group Activity – 12:50 – 1:05 Dan, Ramie, and Yalini will circulate the room to ensure everyone is on-task and to assess level of understanding. Group Discussion – 1:05 – 1:15 Ramie, Yalini, and Dan Ramie and Yalini will call the students to the carpet and lead a discussion where each “speaker” will tell the class their findings. Ramie and Yalini will record the classes findings on 1 big chart paper to create a class total. Dan will be sorting the garbage to provide a visual reminder of how much garbage we had vs. recyclable products. Conclusion: Ramie, Dan, & Yalini After the class total is found, Dan, Yalini, and Ramie will guide the class in a discussion about the importance of recycling. We will highlight how many recyclable items were found in garbage bags. We will demonstrate how much garbage was saved from going to the landfill (which creates pollution). Garbage in landfills creates pollution and we can all do our part to reduce the amount of recyclables that end up in landfills. Follow-up: This lesson would lead into a lesson about creating bar graphs. We could use the tally charts we have created to make bar graphs following all the conventions of bar graphs (ie/ titles, labels, appropriate numbering, etc.) We could also follow the environmental theme and conduct a research project with the school’s janitors to find out how much trash vs. recycling is created schoolwide.
