Zhang-supplementary_materials
advertisement

“Collective shape oscillations of SiGe islands on pit-patterned Si (001)
substrates: a coherent-growth strategy enabled by self-regulated
intermixing” by J. J. Zhang, F. Montalenti, A. Rastelli, N. Hrauda, D.
Scopece, H. Groiss, J. Stangl, F. Pezzoli, F. Schäffler, O. G. Schmidt, L.
Miglio, and G. Bauer
Supplementary material 1:
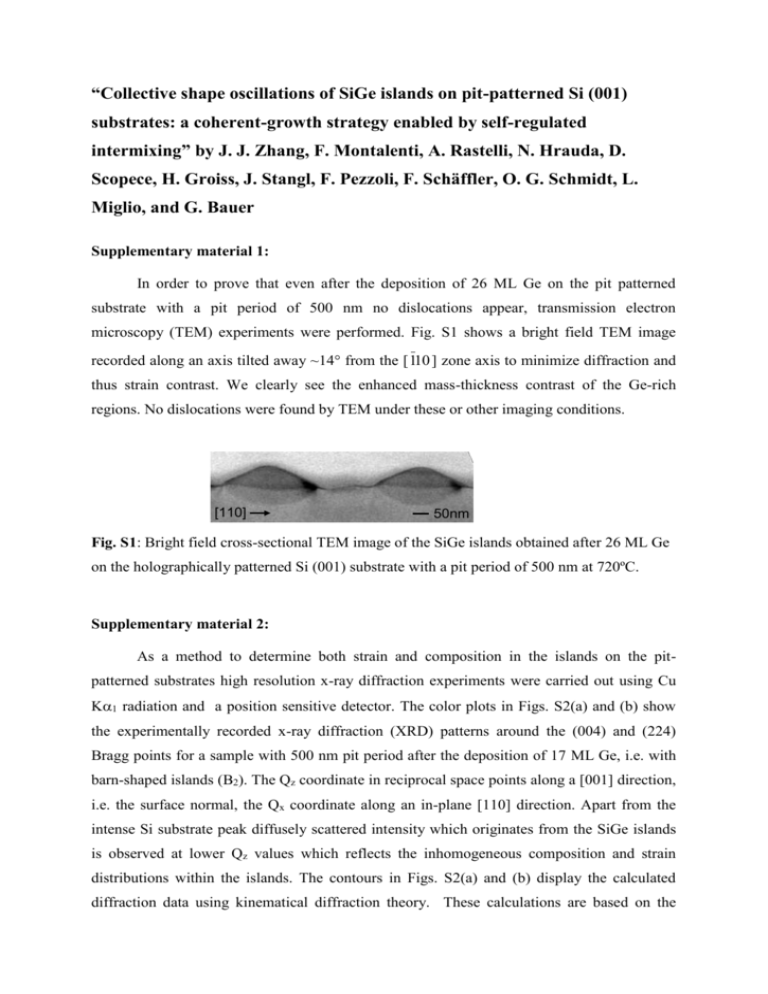
In order to prove that even after the deposition of 26 ML Ge on the pit patterned
substrate with a pit period of 500 nm no dislocations appear, transmission electron
microscopy (TEM) experiments were performed. Fig. S1 shows a bright field TEM image
recorded along an axis tilted away ~14° from the [ 110 ] zone axis to minimize diffraction and
thus strain contrast. We clearly see the enhanced mass-thickness contrast of the Ge-rich
regions. No dislocations were found by TEM under these or other imaging conditions.
[110]
50nm
Fig. S1: Bright field cross-sectional TEM image of the SiGe islands obtained after 26 ML Ge
on the holographically patterned Si (001) substrate with a pit period of 500 nm at 720ºC.
Supplementary material 2:
As a method to determine both strain and composition in the islands on the pitpatterned substrates high resolution x-ray diffraction experiments were carried out using Cu
K1 radiation and a position sensitive detector. The color plots in Figs. S2(a) and (b) show
the experimentally recorded x-ray diffraction (XRD) patterns around the (004) and (224)
Bragg points for a sample with 500 nm pit period after the deposition of 17 ML Ge, i.e. with
barn-shaped islands (B2). The Qz coordinate in reciprocal space points along a [001] direction,
i.e. the surface normal, the Qx coordinate along an in-plane [110] direction. Apart from the
intense Si substrate peak diffusely scattered intensity which originates from the SiGe islands
is observed at lower Qz values which reflects the inhomogeneous composition and strain
distributions within the islands. The contours in Figs. S2(a) and (b) display the calculated
diffraction data using kinematical diffraction theory. These calculations are based on the
lattice displacements resulting from finite element method (FEM) simulations for the threedimensional (3D) strain distribution within the islands and the substrate. As an input for the
FEM simulations, the 3D Ge composition profiles obtained from the selective etching
experiments were imported, and the shape of the islands and pits was based on AFM
investigations. The calculated diffracted x-ray intensities are in very good agreement with the
measured XRD data, supporting the accuracy of the nanotomography results and confirming
in particular the presence of a Ge-poor region in between the Ge-rich (original) core and the
very-Ge-rich top.
Fig. S2: Experimental x-ray diffraction patterns (colorplots, logarithmic intensity scale as
indicated by the color bars) and calculated intensities (contours) utilizing finite element
method (by importing Ge composition profiles obtained from selective etching) around the
(004) and (224) Bragg points for a sample with barn-shaped islands after 17 ML Ge
deposition (B2).
Supplementary material 3:
How the island shape in a pit depends on volume and average concentration can be
estimated by a simple total energy calculation, based on volumetric strain relaxation and
surface energies. Following the experimental indications, a barn of composition x is modeled
as sitting on one inverted, {105} pyramid (fixed composition, 10% in Ge), so that the barn
base perimeter is tangential to the square base of the inverted pyramid. Considering only the
leading volumetric and surface terms, we assign to this configuration the total energy
Ebarn V barn ( x) barn S barn pit s pit .
(1)
In Eq.(1), barn (x) is the volumetric density of elastic energy (including the pit and substrate
deformations) [1] associated with the barn volume V, barn the average surface energy density
for all the barn facets, S barn the total extension of such free surface, pit the average surface
energy density of the pit sidewalls, including the top of the inverted pyramid not covered by
the barn base, and s pit its total extension.
If we now transform the barn into a dome of equal V and x, but larger in base and
smaller in height, the base will climb the pit sidewalls so that the dome base will move
upwards and an additional layer of composition x will be added ontop the base of the inverted
pyramid (still at 10% in Ge). Therefore we obtain
E dome V dome ( x) dome S dome pit s ' pit
.
(2)
Here V includes both the dome and the additional layer, and s' pit takes into account that the
extension of the pit sidewalls is smaller, while the top surface of the inverted pyramid is
larger.
If we take the energy difference between the two configurations
2
Ebarn Edome V barn ( x) dome ( x) V 3 E S
,
(3)
and set it to zero, we obtain for each volume Vcrit the average composition x crit sharing the
stability domain of domes from the one of barns. Here ES includes all the differences in
surface terms obtained by subtracting Eq.(2) from Eq.(1). By considering that the elastic
energy increases with the square of x, the well known relation Vcrit
follows from Eq. (3).
1
xcrit
6
immediately
In Fig. 4 we display the morphological stability diagram for barns and domes with a
blue line sharing the two domains, as obtained by quantifying the various terms introduced
above. In particular, the volumetric elastic-energy terms were evaluated by Finite Element
Method (FEM), following the procedure described in Ref. [1]. The average surface energy
densities for barns and domes were assumed to be equal ( dome barn 65 meV/Å2, see Ref.
[1]), while pit is composed by the smaller contribution coming from the top free surface of
the inverted pyramid (we set 001 60.5 meV/Å2, but variations up to 65 meV/Å2 do not
produce appreciable variations of the blue line) and a larger contribution from the pit
sidewalls. The latter one is contributed by the {105} faceting [2] (which increases the
effective area) and by the high energy contribution of the trenches at the island base perimeter
which are totally unknown. Based on geometric considerations ab initio calculations of the
surface energy with strain [3] and reasonable estimations, we set the effective value for the
surface energy of the pit sidewalls to be 62.5 meV/Å2. However, this is the least known
quantity: in order to give a reasonable error bar to our prediction, we varied it between 60.0
meV/Å2, corresponding to the average surface energy density for {105} facets in a pyramid,
and 65.0 meV/Å2, corresponding to the best estimate for the surface energy of the dome and
the barn [1] (the error range is indicated by dashed black lines in Fig. 4).
[1] M. Brehm, F. Montalenti, M. Grydlik, G. Vastola, H. Lichtenberger, N. Hrauda, M. J.
Beck, T. Fromherz, F. Schäffler, L. Miglio, and G. Bauer, Phys. Rev. B 80, 205321 (2009).
[2] G. Chen, H. Lichtenberger, G. Bauer, W. Jantsch, and F. Schäffler, Phys. Rev. B 74,
035302 (2006).
[3] G. H. Lu, M. Cuma, and F. Liu, Phys. Rev. B 72, 125415 (2005).


