MIAMEglue
advertisement
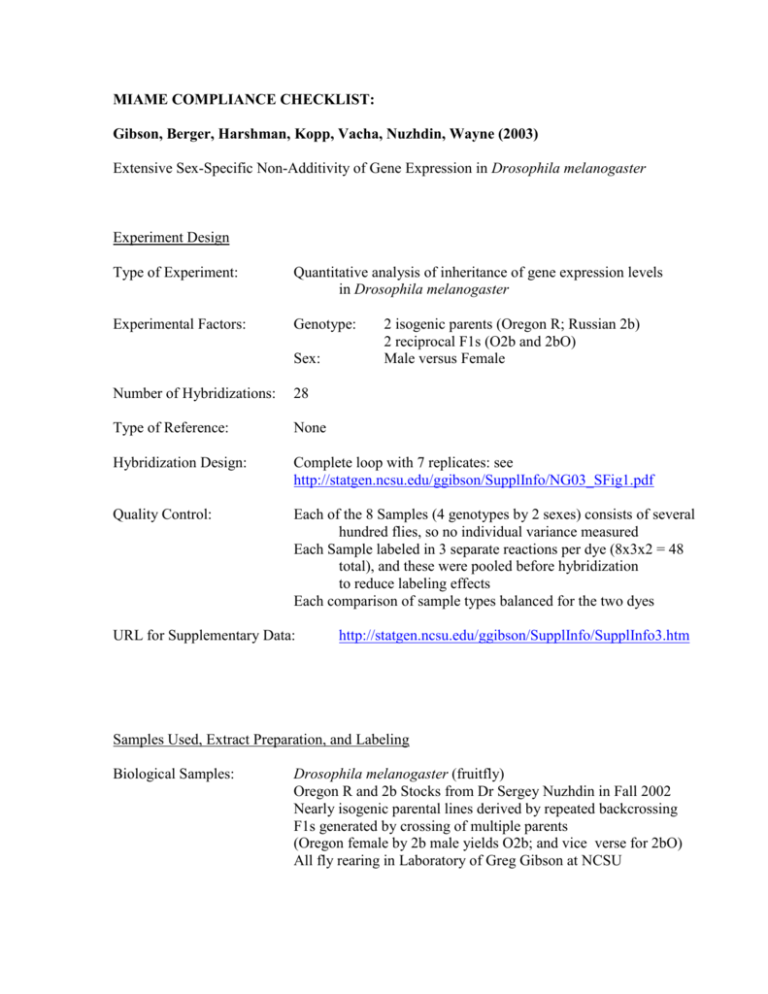
MIAME COMPLIANCE CHECKLIST: Gibson, Berger, Harshman, Kopp, Vacha, Nuzhdin, Wayne (2003) Extensive Sex-Specific Non-Additivity of Gene Expression in Drosophila melanogaster Experiment Design Type of Experiment: Quantitative analysis of inheritance of gene expression levels in Drosophila melanogaster Experimental Factors: Genotype: Sex: 2 isogenic parents (Oregon R; Russian 2b) 2 reciprocal F1s (O2b and 2bO) Male versus Female Number of Hybridizations: 28 Type of Reference: None Hybridization Design: Complete loop with 7 replicates: see http://statgen.ncsu.edu/ggibson/SupplInfo/NG03_SFig1.pdf Quality Control: Each of the 8 Samples (4 genotypes by 2 sexes) consists of several hundred flies, so no individual variance measured Each Sample labeled in 3 separate reactions per dye (8x3x2 = 48 total), and these were pooled before hybridization to reduce labeling effects Each comparison of sample types balanced for the two dyes URL for Supplementary Data: http://statgen.ncsu.edu/ggibson/SupplInfo/SupplInfo3.htm Samples Used, Extract Preparation, and Labeling Biological Samples: Drosophila melanogaster (fruitfly) Oregon R and 2b Stocks from Dr Sergey Nuzhdin in Fall 2002 Nearly isogenic parental lines derived by repeated backcrossing F1s generated by crossing of multiple parents (Oregon female by 2b male yields O2b; and vice verse for 2bO) All fly rearing in Laboratory of Greg Gibson at NCSU Biological Manipulations: Whole adult flies, 7-10 days old, kept on 12 hour light/dark cycle Sexes separated 4-7 days after eclosion (hence mostly mated) Standard cornmeal plust yeast bottles for rearing Flies snap frozen in mid-afternoon to control for diurnal rhythm Hybridization Protocol: Standard Agilent Protocol with Custom Agilent Chip All hybridizations performed at Agilent facility in Palo Alto February 14 and 15, 2003 Labeling Protocol: Also Standard Protocol with Agilent Kit #G2554A External controls: None Measurement Data and Specifications Type of Data: Raw background-subtracted fluorescence intensity transformed to log base 2 scale, and dye effect normalized by loess transformation (Columns BZ and CA of attached data files) Scanning: Agilent Scanner #G2565BA and associated software Data files: 28 raw data files (Agilent) in tab-delimited text format 1 text file suitable for import into SAS or other statistical software lists every log2 measurement before and after ANOVA Step 1 below, with (28x2x21929 rows) 1 TIFF showing a typical image Data transformation: 2-step mixed model ANOVA: - Step 1: remove hybridization and dye effects - Step 2: evaluate gene-specific effects of genotype, sex, and genotype-by-sex interaction Final Gene Expression Table: http://statgen.ncsu.edu/ggibson/SupplInfo/NG03_STable.xls Worksheet 3: All probes Worksheets 1 and 2: Processed significant data for both sexes Array Design General: 60 mer oligonucleotides synthesized in situ on glass slides by Agilent Technologies using phosphoramidite chemistry Drosophila Design Custom designed for UC Davis, but now commercially available Features: Exact feature sequences s and gene identifiers indicated in columns F and J of each of the raw data files
