Appendix
advertisement
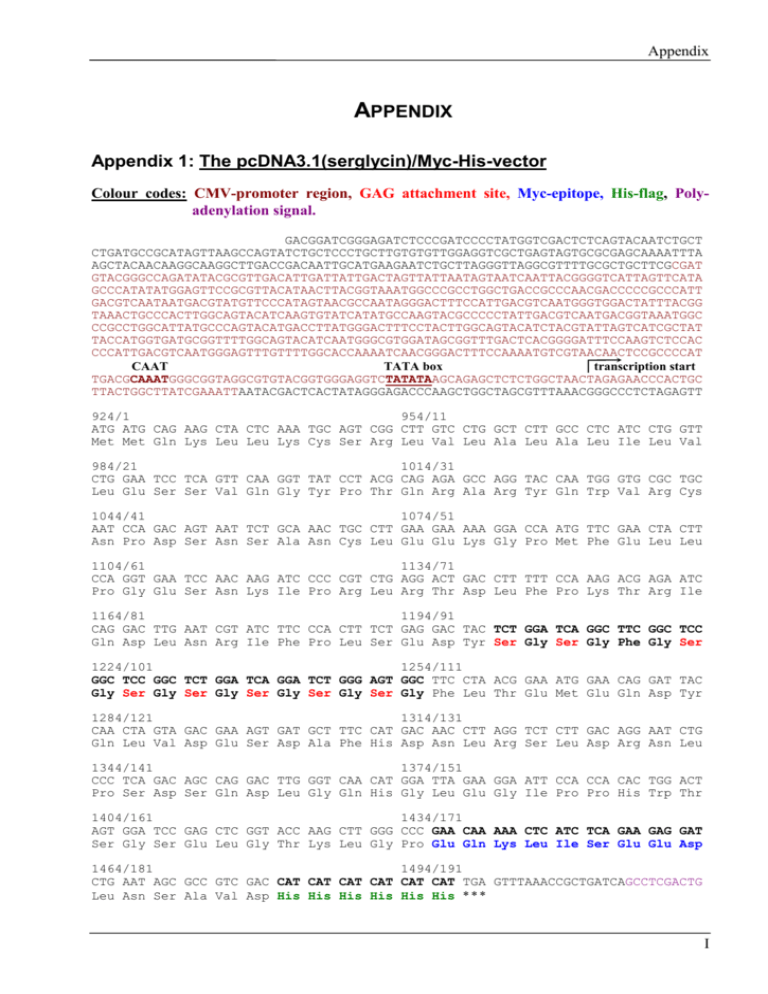
Appendix APPENDIX Appendix 1: The pcDNA3.1(serglycin)/Myc-His-vector Colour codes: CMV-promoter region, GAG attachment site, Myc-epitope, His-flag, Polyadenylation signal. GACGGATCGGGAGATCTCCCGATCCCCTATGGTCGACTCTCAGTACAATCTGCT CTGATGCCGCATAGTTAAGCCAGTATCTGCTCCCTGCTTGTGTGTTGGAGGTCGCTGAGTAGTGCGCGAGCAAAATTTA AGCTACAACAAGGCAAGGCTTGACCGACAATTGCATGAAGAATCTGCTTAGGGTTAGGCGTTTTGCGCTGCTTCGCGAT GTACGGGCCAGATATACGCGTTGACATTGATTATTGACTAGTTATTAATAGTAATCAATTACGGGGTCATTAGTTCATA GCCCATATATGGAGTTCCGCGTTACATAACTTACGGTAAATGGCCCGCCTGGCTGACCGCCCAACGACCCCCGCCCATT GACGTCAATAATGACGTATGTTCCCATAGTAACGCCAATAGGGACTTTCCATTGACGTCAATGGGTGGACTATTTACGG TAAACTGCCCACTTGGCAGTACATCAAGTGTATCATATGCCAAGTACGCCCCCTATTGACGTCAATGACGGTAAATGGC CCGCCTGGCATTATGCCCAGTACATGACCTTATGGGACTTTCCTACTTGGCAGTACATCTACGTATTAGTCATCGCTAT TACCATGGTGATGCGGTTTTGGCAGTACATCAATGGGCGTGGATAGCGGTTTGACTCACGGGGATTTCCAAGTCTCCAC CCCATTGACGTCAATGGGAGTTTGTTTTGGCACCAAAATCAACGGGACTTTCCAAAATGTCGTAACAACTCCGCCCCAT CAAT TATA box transcription start TGACGCAAATGGGCGGTAGGCGTGTACGGTGGGAGGTCTATATAAGCAGAGCTCTCTGGCTAACTAGAGAACCCACTGC TTACTGGCTTATCGAAATTAATACGACTCACTATAGGGAGACCCAAGCTGGCTAGCGTTTAAACGGGCCCTCTAGAGTT 924/1 954/11 ATG ATG CAG AAG CTA CTC AAA TGC AGT CGG CTT GTC CTG GCT CTT GCC CTC ATC CTG GTT Met Met Gln Lys Leu Leu Lys Cys Ser Arg Leu Val Leu Ala Leu Ala Leu Ile Leu Val 984/21 1014/31 CTG GAA TCC TCA GTT CAA GGT TAT CCT ACG CAG AGA GCC AGG TAC CAA TGG GTG CGC TGC Leu Glu Ser Ser Val Gln Gly Tyr Pro Thr Gln Arg Ala Arg Tyr Gln Trp Val Arg Cys 1044/41 1074/51 AAT CCA GAC AGT AAT TCT GCA AAC TGC CTT GAA GAA AAA GGA CCA ATG TTC GAA CTA CTT Asn Pro Asp Ser Asn Ser Ala Asn Cys Leu Glu Glu Lys Gly Pro Met Phe Glu Leu Leu 1104/61 1134/71 CCA GGT GAA TCC AAC AAG ATC CCC CGT CTG AGG ACT GAC CTT TTT CCA AAG ACG AGA ATC Pro Gly Glu Ser Asn Lys Ile Pro Arg Leu Arg Thr Asp Leu Phe Pro Lys Thr Arg Ile 1164/81 1194/91 CAG GAC TTG AAT CGT ATC TTC CCA CTT TCT GAG GAC TAC TCT GGA TCA GGC TTC GGC TCC Gln Asp Leu Asn Arg Ile Phe Pro Leu Ser Glu Asp Tyr Ser Gly Ser Gly Phe Gly Ser 1224/101 1254/111 GGC TCC GGC TCT GGA TCA GGA TCT GGG AGT GGC TTC CTA ACG GAA ATG GAA CAG GAT TAC Gly Ser Gly Ser Gly Ser Gly Ser Gly Ser Gly Phe Leu Thr Glu Met Glu Gln Asp Tyr 1284/121 1314/131 CAA CTA GTA GAC GAA AGT GAT GCT TTC CAT GAC AAC CTT AGG TCT CTT GAC AGG AAT CTG Gln Leu Val Asp Glu Ser Asp Ala Phe His Asp Asn Leu Arg Ser Leu Asp Arg Asn Leu 1344/141 1374/151 CCC TCA GAC AGC CAG GAC TTG GGT CAA CAT GGA TTA GAA GGA ATT CCA CCA CAC TGG ACT Pro Ser Asp Ser Gln Asp Leu Gly Gln His Gly Leu Glu Gly Ile Pro Pro His Trp Thr 1404/161 1434/171 AGT GGA TCC GAG CTC GGT ACC AAG CTT GGG CCC GAA CAA AAA CTC ATC TCA GAA GAG GAT Ser Gly Ser Glu Leu Gly Thr Lys Leu Gly Pro Glu Gln Lys Leu Ile Ser Glu Glu Asp 1464/181 1494/191 CTG AAT AGC GCC GTC GAC CAT CAT CAT CAT CAT CAT TGA GTTTAAACCGCTGATCAGCCTCGACTG Leu Asn Ser Ala Val Asp His His His His His His * * * I Appendix TGCCTTCTAGTTGCCAGCCATCTGTTGTTTGCCCCTCCCCCGTGCCTTCCTTGACCCTGGAAGGTGCCACTCCCACTGT CCTTTCCTAATAAAATGAGGAAATTGCATCGCATTGTCTGAGTAGGTGTCATTCTATTCTGGGGGGTGGGGTGGGGCAG GACAGCAAGGGGGAGGATTGGGAAGACAATAGCAGGCATGCTGGGGATGCGGTGGGCTCTATGGCTTCTGAGGCGGAAA GAACCAGCTGGGGCTCTAGGGGGTATCCCCACGCGCCCTGTAGCGGCGCATTAAGCGCGGCGGGTGTGGTGGTTACGCG CAGCGTGACCGCTACACTTGCCAGCGCCCTAGCGCCCGCTCCTTTCGCTTTCTTCCCTTCCTTTCTCGCCACGTTCGCC GGCTTTCCCCGTCAAGCTCTAAATCGGGGCATCCCTTTAGGGTTCCGATTTAGTGCTTTACGGCACCTCGACCCCAAAA II Appendix Appendix 2: Incorporation of 35(S)sulphate A parallel experiment to the 35(S)sulphate labelling of the transfected MDCK II subclones shown in figure 4.12. Note that in this experiment, the cells were labelled after three days incubation on Transwell polycarbonate filter membranes. This may give a different 35(S)macromolecule secretion compared to four days growth on filter membranes. The secretion of 35(S)macromolecules secreted from polarised cultured cells was analysed by seeding MDCK II subclones into transwell polycarbonate filter membranes (24 mm) in complete medium (method 3.4.2). After 3 days incubation, the cells were labelled with approximately 0.2 mCi/ml 35S(sulphate) for 20 hours. Apical and basolateral media were harvested separately, giving 1 ml apical and 2 ml basolateral medium. Unincorporated 35S(sulphate) was removed by chromatography of 1 ml medium on Sephadex G-50 Fine (method 3.7.3). The capacity of each subclone to incorporate 35S(sulphate) into macromolecules secreted apically and basolaterally was analysed by counting 50 l of the material eluted form the Sephadex G-50 columns. The counted values were used to determine the total amount of 35(S)macromolecules eluted from the Sephadex G-50 Fine column (1.5 ml). III Appendix Appendix 3: Test of PG binding to plasitc tubes In some Hi-Trap chelating chromatography experiments, the recovery after 250 kDa PG purification was much lower than expected. Only 20-50 percent of the labelling activity remained after Hi-Trap chelating chromatography. The Hi-Trap chelating column was thus washed with EDTA to strip the column for Ni2+ ions, to check if any labelled material still was bound to the column matrix. The eluate contained only small amounts of 35(S)sulphate, and thus excluded this possibility. Another possibility was that the 35(S)proteoglycans were adhered to the collecting tube wall. The high negative charge on the glycosaminoglycan chains can bind strongly to positive charges on the plastic tube surface. To test this, 1 ml samples (5000 cpm), were mixed in eppendorp tubes, transferred to the collecting tube and incubated for 20 minutes at room temperature. The samples were then transferred to scintillation tubes and counted. As references, samples were mixed in eppendorp tubes only, before transfer, and directly into the scintillation tubes. All reference samples contained approximately 5000 cpm, but the samples from the tubes contained only half of the activity. This explains the reduced recovery. The collecting tubes (Sarstedt, Germany, No: 55.484) were thus replaced with eppendorp tubes in the following experiments. IV Appendix Appendix 4: Calculation of GAG substitution on 250 kDa PG secreted by TGF- stimulated subclone 1-7 Relative content of GAG Peak 1 Chondroitin sulphate* Heparan sulphate* Elution after Hi-Trap** CS-250 kDa PG in peak 1 HS-250 kDa PG in peak 1 Peak 2 Chondroitin sulphate*** Heparan sulphate*** Elution after Hi-Trap**** CS-250 kDa PG in peak 2 HS-250 kDa PG in peak 2 SUM peak 1 and peak 2 CS-250 kDa PG HS-250 kDa PG SUM secreted 250 kDa PG Clone 1-7 Apical Basolateral 10 10 90 90 15 20 1.5 2 13.5 18 Apical Basolateral 85 85 15 15 27 22 23 19 4 3 Apical Basolateral 24.5 21 17.5 21 42 42 Figure I: Secretion of CS- and HS-250 kDa PG to the apical and the basolateral compartments. Values are from: (*) Figure 4-28.C, (**) Table 4-11, (***) Figure 4-29.C and (****) Figure 4-27.D. Relative contents of GAG CS-250 kDa PG HS-250 kDa PG SUM secreted 250 kDa PG Percent CS and HS CS-250 kDa PG in compartment HS-250 kDa PG in compartment Elution after Anion exchanger Distribution of produced 250 kDa PG CS-250 kDa PG HS-250 kDa PG Clone 1-7 Apical Basolateral 24.5 21 17.5 21 42 42 Apical Basolateral 58 % 50 % 42 % 50 % 35 % 65 % Apical Basolateral 20 % 33 % 14 % 33 % Figure II: Apical and basolateral secretion of CS- and HS-250 kDa PG across the cell layer. V
