Hydrobiology Exercises II
advertisement
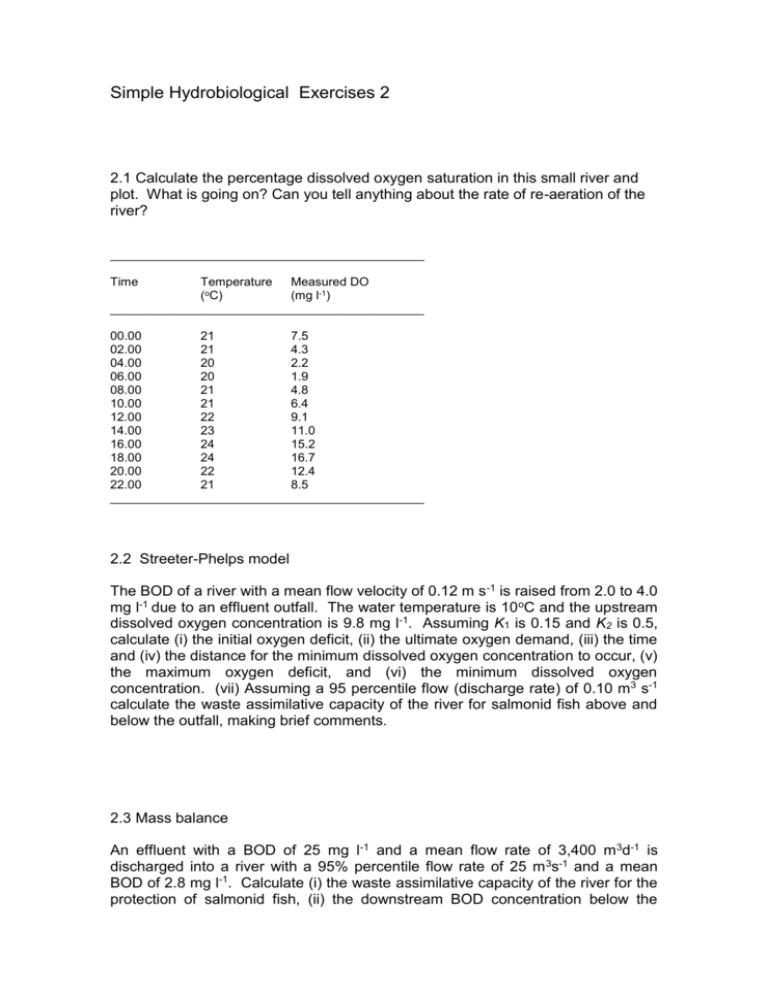
Simple Hydrobiological Exercises 2 2.1 Calculate the percentage dissolved oxygen saturation in this small river and plot. What is going on? Can you tell anything about the rate of re-aeration of the river? _____________________________________________ Time Temperature Measured DO (oC) (mg l-1) _____________________________________________ 00.00 21 7.5 02.00 21 4.3 04.00 20 2.2 06.00 20 1.9 08.00 21 4.8 10.00 21 6.4 12.00 22 9.1 14.00 23 11.0 16.00 24 15.2 18.00 24 16.7 20.00 22 12.4 22.00 21 8.5 _____________________________________________ 2.2 Streeter-Phelps model The BOD of a river with a mean flow velocity of 0.12 m s -1 is raised from 2.0 to 4.0 mg l-1 due to an effluent outfall. The water temperature is 10 oC and the upstream dissolved oxygen concentration is 9.8 mg l-1. Assuming K1 is 0.15 and K2 is 0.5, calculate (i) the initial oxygen deficit, (ii) the ultimate oxygen demand, (iii) the time and (iv) the distance for the minimum dissolved oxygen concentration to occur, (v) the maximum oxygen deficit, and (vi) the minimum dissolved oxygen concentration. (vii) Assuming a 95 percentile flow (discharge rate) of 0.10 m3 s-1 calculate the waste assimilative capacity of the river for salmonid fish above and below the outfall, making brief comments. 2.3 Mass balance An effluent with a BOD of 25 mg l-1 and a mean flow rate of 3,400 m 3d-1 is discharged into a river with a 95% percentile flow rate of 25 m 3s-1 and a mean BOD of 2.8 mg l-1. Calculate (i) the waste assimilative capacity of the river for the protection of salmonid fish, (ii) the downstream BOD concentration below the mixing zone, and (iii) calculate the permissible effluent BOD concentration required to ensure salmonid water quality. Make brief comments. 2.4 Water quality assessment Using Table 9.23 in the course text: (i) calculate the water quality index (WQI) for the raw data given in the table below, (ii) identify the location of the pollution input, (iii) what do you suspect is the cause of the pollution and justify your choice, (iv) plot the WQI values, (v) very briefly explain what is going on between sites. ________________________________________________________________ Distance downstream (km) Dissolved oxygen (%) BOD (mg l-1) Ammonia (mg l-1) E.coli (per 100 ml) pH Total oxidized N (mg l-1) Ortho-phosphate (mg l-1) Suspended solid (mg l-1) Conductivity (μmho/cm) Temperature (oC) 1 Downstream sites 2 3 4 5 0 100 1.2 0.05 500 7.5 0.05 0.001 2 140 12.0 1.0 80 3.7 1.70 6500 7.9 2.0 0.1 6 210 14.0 6.0 52 5.0 2.4 240000 8.0 5.0 0.35 40 1200 18.0 2.5 160 2.0 0.80 4500 8.4 3.0 0.3 8 220 14.2 4.0 40 6.0 5.50 150000 7.8 4.5 0.25 90 240 14.4
