nsf_suv_v2 - World Ozone and Ultraviolet Radiation Data Centre
advertisement
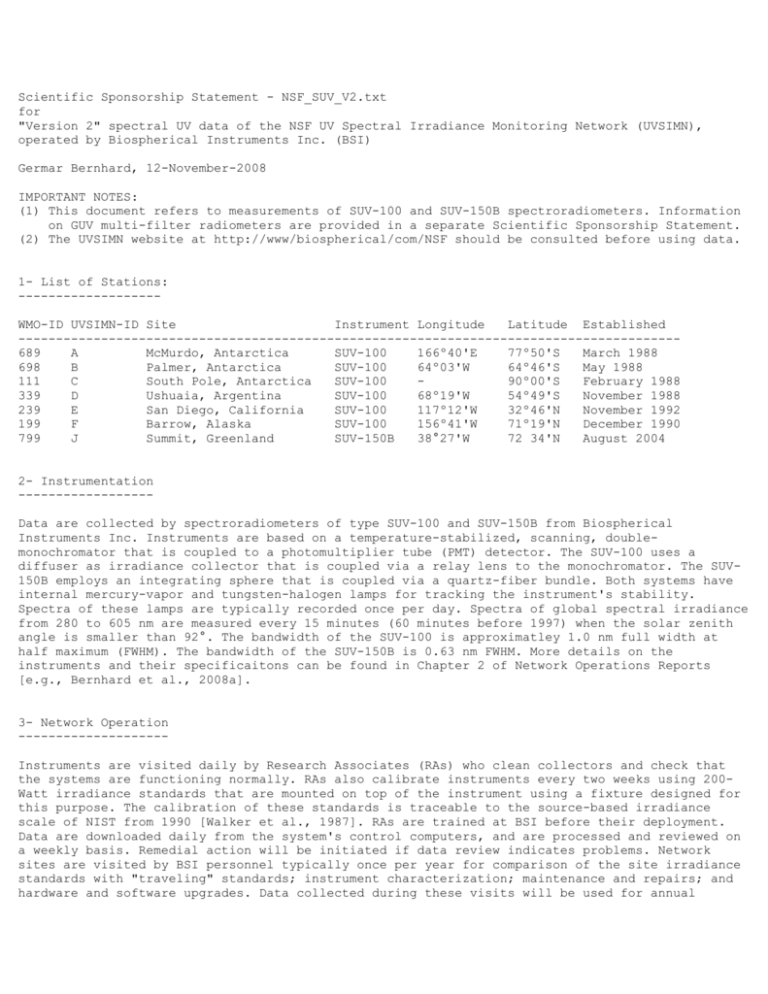
Scientific Sponsorship Statement - NSF_SUV_V2.txt for "Version 2" spectral UV data of the NSF UV Spectral Irradiance Monitoring Network (UVSIMN), operated by Biospherical Instruments Inc. (BSI) Germar Bernhard, 12-November-2008 IMPORTANT NOTES: (1) This document refers to measurements of SUV-100 and SUV-150B spectroradiometers. Information on GUV multi-filter radiometers are provided in a separate Scientific Sponsorship Statement. (2) The UVSIMN website at http://www/biospherical/com/NSF should be consulted before using data. 1- List of Stations: ------------------WMO-ID UVSIMN-ID Site Instrument Longitude Latitude Established ---------------------------------------------------------------------------------------689 A McMurdo, Antarctica SUV-100 166º40'E 77º50'S March 1988 698 B Palmer, Antarctica SUV-100 64º03'W 64º46'S May 1988 111 C South Pole, Antarctica SUV-100 90º00'S February 1988 339 D Ushuaia, Argentina SUV-100 68º19'W 54º49'S November 1988 239 E San Diego, California SUV-100 117º12'W 32º46'N November 1992 199 F Barrow, Alaska SUV-100 156º41'W 71º19'N December 1990 799 J Summit, Greenland SUV-150B 38°27'W 72 34'N August 2004 2- Instrumentation -----------------Data are collected by spectroradiometers of type SUV-100 and SUV-150B from Biospherical Instruments Inc. Instruments are based on a temperature-stabilized, scanning, doublemonochromator that is coupled to a photomultiplier tube (PMT) detector. The SUV-100 uses a diffuser as irradiance collector that is coupled via a relay lens to the monochromator. The SUV150B employs an integrating sphere that is coupled via a quartz-fiber bundle. Both systems have internal mercury-vapor and tungsten-halogen lamps for tracking the instrument's stability. Spectra of these lamps are typically recorded once per day. Spectra of global spectral irradiance from 280 to 605 nm are measured every 15 minutes (60 minutes before 1997) when the solar zenith angle is smaller than 92°. The bandwidth of the SUV-100 is approximatley 1.0 nm full width at half maximum (FWHM). The bandwidth of the SUV-150B is 0.63 nm FWHM. More details on the instruments and their specificaitons can be found in Chapter 2 of Network Operations Reports [e.g., Bernhard et al., 2008a]. 3- Network Operation -------------------Instruments are visited daily by Research Associates (RAs) who clean collectors and check that the systems are functioning normally. RAs also calibrate instruments every two weeks using 200Watt irradiance standards that are mounted on top of the instrument using a fixture designed for this purpose. The calibration of these standards is traceable to the source-based irradiance scale of NIST from 1990 [Walker et al., 1987]. RAs are trained at BSI before their deployment. Data are downloaded daily from the system's control computers, and are processed and reviewed on a weekly basis. Remedial action will be initiated if data review indicates problems. Network sites are visited by BSI personnel typically once per year for comparison of the site irradiance standards with "traveling" standards; instrument characterization; maintenance and repairs; and hardware and software upgrades. Data collected during these visits will be used for annual production of final, quality-controlled data products. More information on network operation can also be found in Chapters 2 of Network Operations Reports [e.g., Bernhard et al., 2008a]. 4- Data Analysis and Quality Control -----------------------------------Data are recorded in a binary format and are converted to ASCII using the program SUV_READ. This programs also applies wavelength and irradiance calibrations to the data taking into account daily scans of the internal mercury and halogen lamps, and the bi-weekly scans of 200-Watt irradiance standards. Data are quality controlled and made available to the public as "Version 0 data of the UVSIMN." The final step is to convert "Version 0 data" to "Version 2 data," which are corrected for the instrument's cosine error; spectrally aligned against a reference solar spectrum by means of a Fraunhofer-line correlation algorithm; normalized to a wavelengthindependent bandwidth of 1.0 nm (SUV-100) or 0.63 nm (SUV-150B); and re-gridded to a uniform wavelength scale. In addition, two spectra are calculated with the radiative transfer model libRadtran/UVSPEC [Mayer and Kylling, 2005] for every measured spectrum. One model spectrum is a clear-sky spectrum, the second takes cloud attenuation into account. Version 2 data have to pass a second rigorous quality control procedure before they are disseminated to the public. Quality control steps include: review of the traceability chain of calibration standards and recalibration if necessary; comparison of internal instrument parameters with target values; check of wavelength accuracy by means of Fraunhofer-line correlation [Bernhard et al., 2004]; comparison of GUV and SUV data; comparison of SUV data with modeling results; comparison with historical data for detecting possible drifts in calibrations; and documentation of quality control results in Operations Reports and metadata files. The dataset made available in WOUDC format is based on Version 2 data with the exception of data from San Diego, which is based on Version 0 data. Binary raw data as well as Version 0 and Version 2 data are also available in their native formats through WOUDC. Data products that are part of the two versions are discussed in Section 6 below. The procedure of converting binary data to Version 0 data is described in Chapter 4 of Network Operation Reports [e.g., Bernhard et al., 2008a]. Results on Quality Control of Version 0 data, including review of irradiance standards, are provided in Chapter 5 of those reports. The procedure of converting Version 0 to Version 2 is described in the technical supplement by Bernhard et al. [2004]. A summary of all Quality Control steps is provided in the document QC.PDF. 5- Uncertainties ---------------A comprehensive uncertainty budget for Version 2 data from South Pole is provided by Bernhard et al. [2004]. Expanded relative uncertainties (coverage factor k = 2, equal to +/- 2 sigma) depend on wavelength and solar zenith angle, amongst other factors, and vary between 4.6% and 13.4%. Expanded uncertainties for spectral irradiance at 310 nm range between 6.2% and 6.4% and are dominated by uncertainties related to calibration, stability, and wavelength errors. At larger wavelengths, the greatest uncertainty arises from insufficient knowledge of the contribution of direct irradiance to global irradiance required for the cosine-error correction procedure. Expanded uncertainties for spectral irradiance at 600 nm range between 4.6% for overcast conditions and 13.4% for periods with variable cloudiness. Expanded uncertainties for erythemal irradiance and the UV Index vary between 5.8% and 6.4%, and are only slightly influenced by sky condition. The expanded wavelength uncertainty of Version 2 spectra is 0.08 nm at 300 nm and about 0.06 nm at wavelength in the UV-A and visible. Uncertainty budgets for other sites were established based on the procedure by Bernhard et al. [2004] and can be found in the following documents: McMurdo: Palmer: Barrow: Summit: Bernhard et al., 2007 Uncertainty_Palmer.pdf Uncertainty_Barrow.pdf Uncertainty_SUV150B.pdf The uncertainty budgets for these four sites are similar to that for South Pole, particularly in the UV-B. Comprehensive uncertainty budgets for Ushuaia and San Diego are not yet available. The budget for Ushuaia should be similar than that of other sites. UV-B measurements for San Diego are too small by 5% as data are based on Version 0 data that have not been corrected for the cosine error. 6- Version 0 and Version 2 Data Products ---------------------------------------In addition to data that are part of the official WOUDC catalogue, native Version 0 and Version 2 data are also available through the WOUDC. All data are provided as comma-separated ASCII tables. "Version 0 data" include: - Solar spectra of global irradiance between 280 and 605 nm - System parameters sampled during solar scans ("Database 1") - Measurements at specific wavelengths, extracted from full-resolution spectra ("Database 2"). - Spectral integrals (e.g., UV-B and UV-A) and "dose-rates" (e.g. erythemal UV) based on six action spectra ("Database 3") - Information from scans of the internal lamp ("Database 5") - Spectral integrals and dose-rates from Database 3 integrated over 24 hour time periods Contents and format of Version 0 data is described in Chapter 6 of Network Operations Reports [e.g., Bernhard et al., 2008a]. "Version 2 data" include: - Solar spectra of global irradiance between 280 and 600 nm, re-gridded and normalized to 1 nm FWHM - Measurements at specific wavelengths, extracted from full-resolution spectra. - Spectral integrals (e.g., UV-B and UV-A) and "dose-rates" based on 15 action spectra - Spectral integrals and dose-rates from Database 3 integrated over 24 hour time periods. - Total ozone - Effective surface albedo - Cloud optical depth at 450 nm - Model spectra for clear and cloudy sky and model input parameters - Results of Quality Control (wavelength accuracy, presence of spikes in spectra, wavelength from which onward spectrum can be trusted, etc.) Contents and format of each of these datasets is described in separate PDF documents, see Documentation_Overview.PDF 7- Publications --------------As of November 2008, at least 173 publications have used UVSIMN data, of which 102 are peerreviewed. These publications include work in atmospheric sciences (45%); effects research (30%); and validation of satellite, model, and instrument data (25%). The following publications are particularly relevant. 7.1. Network overview - Annual Operations Reports: e.g. Bernhard et al., 2008 - Initial network setup: Booth et al., 1994 7.2. Data processing and quality control - Version 0 processing: Annual Operation Reports, e.g. Bernhard et al., 2008 - Version 2 processing: Bernhard et al., 2004 7.3. Publications by site: - McMurdo Station: Bernhard et al., 2006 - Palmer Station: Bernhard et al., 2005b - South Pole: Bernhard et al., 2004 - Ushuaia: Diaz et al., 2001 - San Diego: Diaz et al., 2001 - Barrow: Bernhard et al., 2008 - Summit: Bernhard et al., 2008b - Comparison all sites: Bernhard et al., 2009 - Austral sites: Liao and Frederick, 2005 7.4. Result of intercomparison campaigns - SUV-100: Bernhard et al., 2008c, Lantz et al., 2002, Seckmeyer et al., 1995 - SUV-150: Wuttke et al., 2006 7.5. Validation of satellite UV data: - Based on Version 0 data: Kalliskota et al., 2000 - Based on Version 2 data: Tanskanen et al., 2007 7.6. Validation of total ozone data - Against satellites: Bernhard et al., 2003 - Against Dobson and Brewer: Bernhard et al., 2003 and 2005a 7.7. Effect of UV radiation on the biosphere See complete list of references: References_UVSIMN.PDF 8- Contact information ---------------------Germar Bernhard or Rocky Booth Biospherical Instruments Inc 5340 Riley Street San Diego, CA 92110-2621 USA Phone: +1-619-686-1888 FAX: +1-619-686-1887 Email: nsfdata_at_biospherical.com Internet: http://www/biospherical/com/NSF 9- Data Use Policy -----------------Data can be used with no restriction, but we kindly ask to (1) Include the following acknowledgement in publications using UVSIMN data: UV data was provided by the NSF UV Monitoring Network, operated by Biospherical Instruments Inc under a contract from the United States National Science Foundation's Office of Polar Programs via Raytheon Polar Services Company. (2) Notify us of publications that have use UVSIMN data and send PDF copies, if possible. 10- References ------------A complete list of references is provided in: References_UVSIMN.PDF Bernhard, G., C.R. Booth, and R.D. McPeters. (2003). Calculation of total column ozone from global UV spectra at high latitudes. J. Geophys Research, 108(D17), 4532, doi:10.1029/2003JD003450. Bernhard, G., C. R. Booth, and J. C. Ehramjian. (2004). Version 2 data of the National Science Foundation’s Ultraviolet Radiation Monitoring Network: South Pole, J. Geophys. Res., 109, D21207, doi:10.1029/2004JD004937. Bernhard, G., R.D. Evans, G.J. Labow, and S.J. Oltmans. (2005a). Bias in Dobson Total Ozone Measurements at High Latitudes due to Approximations in Calculations of Ozone Absorption Coefficients and Airmass. J. Geophys. Res., 110, D10305, doi:10.1029/2004JD005559, 2005. Bernhard, G., C. R. Booth, and J. C. Ehramjian. (2005b). UV climatology at Palmer Station, Antarctica, in: Ultraviolet Ground- and Space-based Measurements, Models, and Effects V, edited by G. Bernhard, J. R. Slusser, J. R. Herman, W. Gao, Proc. SPIE Int. Soc. Opt. Eng., 588607-1 588607-12. Bernhard G., C.R. Booth, J.C. Ehramjian, and S.E. Nichol. (2006) UV climatology at McMurdo Station, Antarctica, Based on Version 2 data of the National Science Foundation’s Ultraviolet Radiation Monitoring Network, J. Geophys. Res., 111, D11201, doi:10.1029/2005JD005857. Bernhard, G., C. R. Booth, J. C. Ehramjian, R. Stone, and E. G. Dutton (2007), Ultraviolet and visible radiation at Barrow, Alaska: Climatology and influencing factors on the basis of version 2 National Science Foundation network data, J. Geophys. Res., 112, D09101, doi:10.1029/2006JD007865. Bernhard, G., C. R. Booth, J. C. Ehramjian, and V. V. Quang. (2008a). NSF Polar Programs UV Spectroradiometer Network 2006-2007 Operations Report Volume 16.0, Biospherical Instruments Inc., San Diego. Bernhard, G., C. R. Booth, and J. C. Ehramjian. (2008b). Comparison of UV irradiance measurements at Summit, Greenland; Barrow, Alaska; and South Pole, Antarctica, Atmos. Chem. Phys., 8, 4799– 4810. Bernhard, G., R. L. McKenzie, M. Kotkamp, S. Wood, C. R. Booth, J. C. Ehramjian, P. Johnston, and S. E. Nichol. (2008c). Comparison of ultraviolet spectroradiometers in Antarctica, J. Geophys. Res, 113, D14310, doi:10.1029/2007JD009489. Bernhard, G., C. R. Booth, and J. C. Ehramjian. (2009). Climatology of Ultraviolet Radiation at High Latitudes Derived from Measurements of the National Science Foundation’s Ultraviolet Spectral Irradiance Monitoring Network, accepted for publication in: UV Radiation in Global Change: Measurements, Modeling and Effects on Ecosystems, edited by W. Gao and J. Slusser, Springer-Verlag and Tsinghua University Press. Booth, C.R., T.B. Lucas, J.H. Morrow, C.S. Weiler, and P.A. Penhale. (1994). The United States National Science Foundation's Polar Network for Monitoring Ultraviolet Radiation. Antarctic Research Series, edited by C.S. Weiler and P.A. Penhale, 62, 17-37, American Geophysical Union, Washington, D.C. Kalliskota, S., J. Kaurola, P. Taalas, J. Herman, E. Celarier and N. Krotkov. (2000). Comparison of daily UV doses estimated from Nimbus 7/TOMS measurements and ground-based spectroradiometric data, J. Geophys. Res., 105(D4), 5059-5067. Lantz, K., P.Disterhoft, E.A.Early, J.DeLuisi, A.Thompson, J.Berndt, L.Harrison, P.Kiedron, J.Ehramjian, G.Bernhard, L.Cabasug, J.Robertson, W.Mou, T.Taylor, J.Slusser, D.Bigelow, B.Durham, G.Janson, D.Hayes, M.Beaubien, and A.Beaubien. (2002). The 1997 North American interagency intercomparison of ultraviolet spectroradiometers including narrowband filter radiometers. J. Res. Natl. Inst. Stand. Technol., 107, 19-62. Liao, Y. and J.E. Frederick. (2005). The ultraviolet radiation environment of high southern latitudes: springtime behavior over a decadal timescale, Photochem. Photobiol., 81, 320-324. Mayer, B., and A. Kylling. (2005). Technical note: The libRadtran software package for radiative transfer calculations—Description and examples of use, Atmos. Chem. Phys. Disc., 5, 1319– 1381. Seckmeyer, G., B. Mayer, G. Bernhard, R.L. McKenzie, P.V. Johnston, M. Kotkamp, C.R. Booth, T.B. Lucas, T. Mestechkina, C.R. Roy, H.P. Gies, and D. Tomlinson. (1995). Geographical differences in the UV measured by intercompared spectroradiometers. Geophysical Research Letters, 22(14), 18891892. Tanskanen, A., A, Lindfors, A. Määttä, V. Fioletov, G. Bernhard, R. McKenzie, and J. Tamminen. (2007). Validation of with ground-based UV measurement data, N. Krotkov, J. Herman, J. Kaurola, T. Koskela, K. Lakkala, Y. Kondo, M. O’Neill, H. Slaper, P. den Outer, A. F. Bais, daily erythemal doses from Ozone Monitoring Instrument J. Geophys. Res., 112, D24S44, doi:10.1029/2007JD008830. Walker, J.H., R.D. Saunders, J.K. Jackson, and D.A. McSparron. (1987). Spectral irradiance calibrations, NBS Spec. Publ. U.S., 250-20. Wuttke S., G. Seckmeyer, G. Bernhard, J. Ehramjian, R. McKenzie, P. Johnston, and M. O'Neil. (2006). New spectroradiometers complying with the NDSC standards, J. Atmos. Ocean. Tech., 23(2), pages 241–251.
