Theories of Uncertainty for Risk Assessment
advertisement
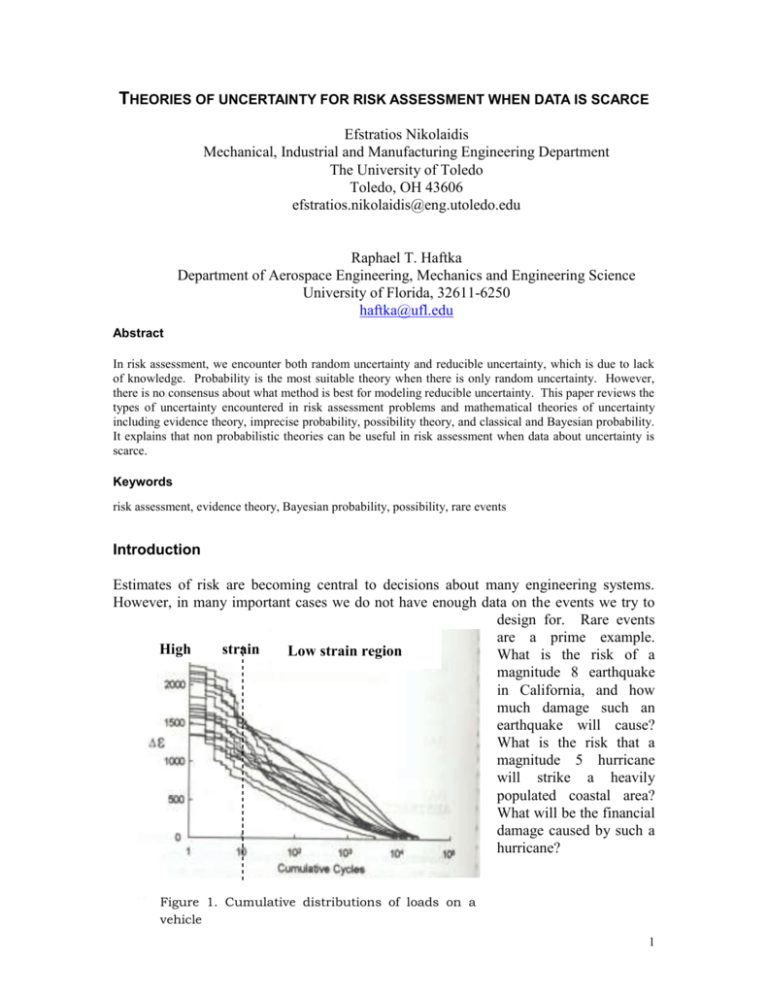
THEORIES OF UNCERTAINTY FOR RISK ASSESSMENT WHEN DATA IS SCARCE Efstratios Nikolaidis Mechanical, Industrial and Manufacturing Engineering Department The University of Toledo Toledo, OH 43606 efstratios.nikolaidis@eng.utoledo.edu Raphael T. Haftka Department of Aerospace Engineering, Mechanics and Engineering Science University of Florida, 32611-6250 haftka@ufl.edu Abstract In risk assessment, we encounter both random uncertainty and reducible uncertainty, which is due to lack of knowledge. Probability is the most suitable theory when there is only random uncertainty. However, there is no consensus about what method is best for modeling reducible uncertainty. This paper reviews the types of uncertainty encountered in risk assessment problems and mathematical theories of uncertainty including evidence theory, imprecise probability, possibility theory, and classical and Bayesian probability. It explains that non probabilistic theories can be useful in risk assessment when data about uncertainty is scarce. Keywords risk assessment, evidence theory, Bayesian probability, possibility, rare events Introduction Estimates of risk are becoming central to decisions about many engineering systems. However, in many important cases we do not have enough data on the events we try to design for. Rare events are a prime example. High strain Low strain region What is the risk of a region magnitude 8 earthquake in California, and how much damage such an earthquake will cause? What is the risk that a magnitude 5 hurricane will strike a heavily populated coastal area? What will be the financial damage caused by such a hurricane? Figure 1. Cumulative distributions of loads on a vehicle 1 Unfortunately, estimating the probability of rare events from more frequent events entails a great degree of uncertainty as shown in Fig. 1. The figure shows the number of times (cycles, horizontal axis) that a certain strain level (vertical axis) will be reached during the life of a vehicle. High strain levels (e.g., levels above 2000) are rare, so that they are reached only a few times (e.g., less than 10). However, it can be seen from the figure that the distribution of these rarely achieved strain levels is different from the distribution of more common lower strain levels. Indeed, the shape of the cumulative distribution from 1 to 10 cycles is different than that for higher number of cycles. If we did not have the left part of the curves (high strain region) and extrapolated from the right, we would have underestimated the strains that are likely to be experienced by the vehicle. In addition to rare events, there are other common situations where we do not have enough data to estimate risks accurately. These include risk assessments that depend on extremely complex simulations of physical reality that are the edge of our modeling ability. These simulations use tools from different disciplines that may be highly coupled. Such simulations are prone to modeling errors, human errors and algorithmic failures that are difficult to characterize by well-defined probability distributions. When data is scarce or physical understanding is limited, it is important to estimate the uncertainty in the estimates of risk of a system. To estimate this uncertainty in probability, we treat the parameters of the probability distributions of the random variables (e.g., the mean and standard deviation) as random variables (Der Kiureghian and Liu, 1985). Then we can compute a probability distribution of the probability of failure, which is useful because it indicates the uncertainty in the estimated probability of failure. However, there are concerns about this approach: a) Selection of a prior probability distribution of the parameters is an issue (Berger, 1985). When the parameters of a probability distribution are not known well, it may be difficult to select a prior probability distribution (including its parameters) for these parameters. Unfortunately, different non-informative prior distributions yield considerably different levels of confidence in the estimated failure probability. b) It is difficult to account for uncertainty in the type of the probability distribution of the uncertain variables. c) The process of selecting probability distributions for variables for which little or no data is available and prior distributions for the distribution parameters is highly subjective. When two persons translate their vague notions about the magnitude of the uncertainty to an actual number the number is highly subjective. Yet the final results do not provide a measure of the extent of subjectivity that could warn decision-makers that they should obtain risk estimates from more than one person or one group. d) The probability distribution of the probability of failure is a measure of only the uncertainty for one person, not necessarily catching the subjectivity component. If you asked the person explicitly to put the variation that he/she thought other people might 2 add, then you would end-up with a completely different probability distribution of the probability of failure. A family of theories of uncertainty, including imprecise probability and evidence theory, has been developed. These theories can be combined with probability theory to develop a framework that is suitable for risk assessment of systems when data is scarce. First, this paper reviews the types of uncertainty involved in risk assessment problems. Then it presents a family of theories of uncertainty and demonstrates how we can apply them in risk assessment of a series system, when there is uncertainty in the probabilities of failure of the components of the system. Types of uncertainty Researchers classify uncertainty into two main types: irreducible and reducible (Ang and Tang, 1984). Irreducible (random) uncertainty (or variability) is due to inherent randomness in physical phenomena or processes. Collecting data cannot reduce it. Reducible uncertainty is due to lack of knowledge. Oberkampf et al., (2000), considered a third type of uncertainty, called error, which is a recognizable deficiency in simulation. Assumptions and simplifications in simulation, and lack of grid convergence, introduce reducible uncertainty and errors. Collecting data or refining models can reduce this type of uncertainty. Nikolaidis and Kaplan (1992) studied the relative importance of the random and reducible components of uncertainty in rare events. They concluded that the random component of the uncertainty tends to become less significant for rare events. Figure 2 shows the probability density function of the maximum wind speed at a certain location over periods ranging from 1 year to 500 years. The annual maximum wind speed is assumed to follow the Rayleigh probability distribution with a mean value of 88 km/hr. The maximum values of the wind speed over consecutive one-year periods are assumed independent. The scatter reduces as the length of the period increases. It is important to interpret correctly this figure. The figure shows only the random component of uncertainty, not the total uncertainty. The random component decreases with the length of the period because the peaks of the wind speed are independent from one year to the next. The reducible component of uncertainty in this problem is likely to be due to uncertainty about the deviation of the wind speeds from the Rayleigh distribution. It can be shown that this uncertainty increases with the length of the period. 3 probabibility density 0.02 f X( x) f Yn x 5 0.01 f Yn x 50 f Yn x 500 0 0 0 200 400 x wind speed (km/h) 400 one year wind speed 5 year wind sp eed 50 year wind s peed 500 year speed Figure 2. Random uncertainty in maximum wind speed over an n-year period PDF of fatigue damage Klir and Yuan (1995) and Klir and Weirman (1998) defined three types of uncertainty: conflict, nonspecificity and fuzziness. Only the first two types are of interest in this paper. Conflicting pieces of evidence induce conflict. For example, portion of the evidence collected by flipping a coin supports the event “tail”, whereas the remaining portion supports the event “head”. Strife is a measure of conflict and it measured in bits of information. Probability theory can characterize conflict. Shannon entropy is a limiting case of Strife. Evidence that supports a collection of outcomes instead of one outcome induces Nonspecificity. For example, if an expert states that she/he only knows that the stress in a specimen is between 50 and 500 MPa, then he/she introduces Nonspecificity because he/she does not specify the precise value of the stress in the above interval. In a general risk assessment problem, we have both Conflict and Nonspecificity. Conflict is closely related to random uncertainty, while Nonspecificity is related to reducible uncertainty. Klir and Weirman (1998) proposed axiomatic foundations for Strife and Nonspecificity and proposed measures that satisfy these axioms. They showed that these measures exist and are 10 8 1 unique. They also 9 4.444 10 9 proposed a measure of the 1 10 total uncertainty, called f D( d )1 10 10 aggregate uncertainty and proved that it satisfies a set 11 1 10 of axioms. 12 4.444 10 1 10 12 10 10 10 10 0 2 10 4 10 6 10 8 10 6 10 d 6.25 10 6.25 10 fatigue damage Figure 3. Probability density of fatigue damage of a steel specimen assuming that the applied stress is uniformly distributed between 50 MPa and 500 MPa Mathematical theories of uncertainty Several researchers have reported that use of 4 probabilistic models, in problems where data is scarce, might yield questionable results (Ben-Haim and Elishakoff, 1990, Melchers, 1987, Neal et al., 1992). Consider the following problem: a steel specimen is subjected to a harmonic stress. We only know that the amplitude of the stress can be between 50 and 500 MPa. We want to find the fatigue damage inflicted to the specimen by one load cycle. Assume that fatigue damage is proportional to the fourth power of the stress amplitude, S4. Using the maximum entropy principle to model the stress, we select a uniform probability density (Kapur and Kevasan 1992). Figure 3 shows the probability density function of the fatigue damage, obtained using probability calculus, assuming that the damage is equal to S4. According to the results of probabilistic analysis, it is very unlikely that fatigue damage will exceed 1010 MPa4. However, this result creates the illusion of safety because it is not consistent with the evidence available about the stress. Indeed, all we know is that the damage is between 504 and 5004. If we were sure that the stress was equally likely to assume any value in the range from 50 to 500 then the result in Fig. 3 would be correct, but this is not the case. Upper and lower bounds of the probability of failure would be very useful in this problem and help avoid serious errors in assessing risk. There is consensus that probability is the best theory for characterizing random uncertainty when there is sufficient information on the probability distribution but there is no agreement about what theory of uncertainty is best for reducible uncertainty and error. Probability relies on the additivity axiom to estimate probabilities of events using the law of large numbers. Unfortunately, this axiom does not allow one to express his/her lack of knowledge in situations where data is scarce. In the example of the steel specimen, the evidence supports the fact that the stress varies between 50 to 500 MPa, and only this fact. If one partitions the range from 50 to 500 MPa into two intervals of equal length then the additivity axiom forces one to assign a probability of 0.5 to each interval. But the evidence does not support this. There is a rich collection of theories for modeling all types of uncertainty. These theories are not in conflict with Bayesian or classical probability but rather provide tools that complement probabilistic methods for risk assessment of systems that fail rarely. These theories are flexible enough to provide tools for modeling both Nonspecificity and Conflict types of uncertainty (Fig. 4). Classical probability, Bayesian probability and possibility are members of this family. The most general theory is based on Sugeno’s fuzzy measure. The other theories in this family are derived from Sugeno’s measure by replacing the axioms of fuzzy measure with more restrictive axioms. Evidence theory allows one to model uncertainty when one can estimate the probabilities of only some subsets (overlapping or disjoint) of the outcome space of an experiment. This is a generalization of probability theory where one can estimate the probabilities of all mutually exclusive outcomes of an experiment. Evidence theory (Shafer, 1976, Almond, 1995) uses Plausibility (upper bound of probability) and Belief (lower bound of probability) to measure the likelihood of events. A principal difference between these theories is that the additivity axiom about the probability of the union of disjoint events in probability theory is replaced with less restrictive axioms. 5 We believe that when we use probability to model reducible uncertainty (e.g., uncertainty in the true probability distribution of the stress) we unwittingly introduce extraneous information into our models that may lead to counterintuitive results. Other researchers share this opinion. Although most studies in structural reliability use a probability to characterize modeling errors, some studies have argued that possibility (Dubois and Prade, 1988) is better for modeling errors (Kubic and Stein, 1988, Wood and Antonsson, 1990, and Wood, et al., 1992). Figure 4: Family of theories of uncertainty Sugeno's fuzzy measure Evidence theory Measures of likelihood: plausibility and belief, types of uncertainty: Nonspecificity and Conflict Imprecise probability Measures of likelihood: upper and lower probability Probability Measure of likelihood: probability Type of uncertainty; Conflict Measure of uncertainty: Shannon entropy Classical Possibility Measures of likelihood: Possibility and Necessity Types of uncertainty: Nonspecificity Bayesian Besides the family of theories in Fig. 4, a designer can use Robust Reliability to design a system, when there is little data (Ben-Haim, 1996). Interval arithmetic can also be useful if a designer can only specify a range in which an uncertain variable can vary (Mullen and Muhanna, 1999). The following example shows how we can use evidence theory when data is scarce. An expert tries to estimate the likelihood of an earthquake of magnitude greater than 8 in Southern California over the next ten years. Subjective probability is the degree to which one believes that an event it will occur, and it can be determined by one's willingness to make a commitment in the occurrence of this event (bet that the event will occur). If an expert does not have enough evidence for or against the occurrence of an event, then the expert will be unwilling to make a commitment in the occurrence of an earthquake but also in the nonoccurrence of the earthquake. It is more representative of the expert's state of belief to say that his/her belief in both events "a severe earthquake will occur" and "a severe earthquake will not occur" is very low, say 0.1. Using this information, evidence theory assigns a plausibility of 0.9 to each of the events of having and not having an earthquake of magnitude greater than 8, because both events are plausible. The large gap between the plausibility and the belief reflects the high uncertainty in the true probability of the occurrence of an earthquake. This should be contrasted with probability that, because of the additivity axiom, constrains the probabilities assigned to an event and its complement to add up to one. 6 Evidence theory has the following advantages: a) Evidence theory models both reducible and irreducible uncertainty. Consider a problem of assessing the risk of yielding failure of a specimen for which we have only enough data in a region around the mean value (main body of the distribution) but we do not know the shape of probability distribution of the tails. In this case, we have both randomness (variability in yield stresses of a sample of specimens) and reducible uncertainty (e.g., ignorance of the shape of the tail of the probability distribution of the yield stress). One can express his/her ignorance about the likelihood of the yield stress being extremely small by saying that it is plausible that the yield stress is very small and also that it is not very small. To do so one assigns a large Plausibility and a low Belief to the event that the yield stress is very small. b) Evidence theory provides a measure of the uncertainty in the estimate of risk. The larger the gap between the Plausibility and Belief in the previous example, the larger the uncertainty in the estimated risk of the yield stress becoming extremely small. Example of assessment of risk of a series system The following example demonstrates that evidence theory can provide an indication of the confidence in the risk assessment of a system consisting of n independent, nominally identical components in series, when there is uncertainty in the probabilities of survival and failure of the components. An expert states that that he/she knows that the probability of survival, r, of a single component is at least 0.8. In case A, the expert states that the probability of failure, , is at least 0.15, while in case B, it is at least 0.05. In case A, there is less uncertainty in the true probabilities of survival and failure of the components than case B. In this simple problem, using evidence theory (Klir and Yuan, 1995), we find that the Plausibility (upper probability) of system failure is: Pl ( F ) 1 r n . The Belief (lower probability) of failure is: B( F ) 1 (1 ) n . Nonspecificity of a system with 10 components is in case A is 0.5 bits1, while in case B it is 1.5 bits, which reflects the fact that there is more reducible uncertainty in case B. Figure 5 shows the Plausibility and Belief of failure in cases A and B. Note the difference in the levels of confidence in the risk assessment of the system in the two cases and the decrease in the confidence with increasing number of components in series. 1 Nonspecificity and Conflict are measured in bits of information. 7 Plausibility and belief Plausibility and belief 1 0.5 0 0 5 10 1 0.5 0 0 plausibility of failure belief of failre Case A 5 10 plausibility of failure belief of failure Case B Figure 5. Plausibility and belief of series system failure Conclusions There is a rich collection of theories for modeling all types of uncertainty. These theories are not in conflict with Bayesian or classical probability but rather provide tools that complement probabilistic methods for risk assessment of systems that fail rarely. Probability is the most suitable method for modeling random uncertainty when there is sufficient information on the probability distribution. Nonprobabilistic methods (evidence theory, imprecise probability, and possibility) can be useful in modeling reducible uncertainty because they account for both Conflict and Nonspecificity types of Uncertainty and provide estimates of the error in estimates of risk of a system. Since all these methods provide estimates of uncertainty that depend on highly subjective selection of prior probability distributions, possibility distributions etc. by analysts, it may be desirable to find ways of providing decision-makers with measures of the degree of subjectivity in the final results. Acknowledgements The authors appreciated the comments and suggestions of Dr. William Oberkampf. References Almond, R.G., Graphical Belief Modeling, Chapman and Hall, London, 1995. Ang, A. and Tang, W, 1984, Probability Concepts in Engineering Planning and Design: Vol. II Decision, Risk and Reliability, J. Wiley and Sons, New York. Berger, J. O., 1985, Decision Theory and Bayesian Analysis, Springer-Verlag, New York, pp. 109-113. Ben-Haim, Y., 1996, Robust Reliability, Springer Verlag. Ben-Haim, Y. and Elishakoff, I., 1990, Convex Models of Uncertainty in Applied Mechanics, Elsevier, Amsterdam. 8 Der Kiureghian, A., and Liu, P-L., 1985, “Structural Reliability under Incomplete Probability Information,” Division of Structural Engineering and Mechanics, University of California at Berkeley, Report No. CEE8205049. Dubois, D. and Prade, H., 1988, Possibility Theory, Plenum Press, New York. Kapur, J.N. and Kevasan, H. K., 1992, Entropy Optimization Principles with Applications, Academic Press, New York. Klir, J. G., Yuan, B., 1995, Fuzzy Sets and Fuzzy Logic, Prentice Hall, Upper Saddle River. Klir, J. G., and Wierman, M. J., 1998, Uncertainty-Based Information, Physica-Verlag. Kubic, W. L., and Stein, F. P., 1988, A Theory of Design Reliability Using Probability and Fuzzy Sets, American Institute of Chemical Engineers Journal, Vol. 34, No. 4, pp. 583-601. Melchers, R. E., 1987, Structural Reliability, Analysis and Prediction, Ellis Horwood Limited, West Sussex, England. Mullen, R. L., and Muhanna, R. L., 1999, “Interval-Based Geometric and Material Uncertainty for Mechanics Problems,” 13th ASCE Engineering Mechanics Division Conference, ASCE, Baltimore, Maryland. Nikolaidis, E., and Kaplan, P., 1992, "Uncertainties in Stress Analyses on Marine Structures, Parts I and II," International Shipbuilding Progress, Vol. 39, No. 417, pp. 19-53 and Vol. 39, No. 418, June 1992, pp. 99-133. Oberkampf, W. L., DeLand, S. M., Rutherford, B. M., Diegert, K. V., Alvin, K. F., 2000, “Estimation of Total Uncertainty in Modeling and Simulation”, Sandia Report SAND2000-0824, April 2000, Albuquerque, NM. Shafer, G., 1976, A Mathematical Theory of Evidence, Princeton University Press, Princeton. Socie, D., 1999, “Quantifying Variability and Durability in Service Loading Conditions,” 5th ISSAT International Conference on Reliability and Quality in Design, Las Vegas, Nevada, pp. 6-10. Thoft-Christensen, P., and Murotsu, Y., 1986, Application of Structural Systems Reliability Theory, Spinger-Verlag, New York. Walley, P., 1991, Statistical Reasoning with Imprecise Probabilities, Chapman and Hall, London. Wood, K, and Antonsson, E., 1990, “Modeling Imprecision and Uncertainty in Preliminary Engineering Design,” Mechanism and Machine Theory, Vol. 25, No. 3, pp. 305-324. 9


