Grading Rubric
advertisement
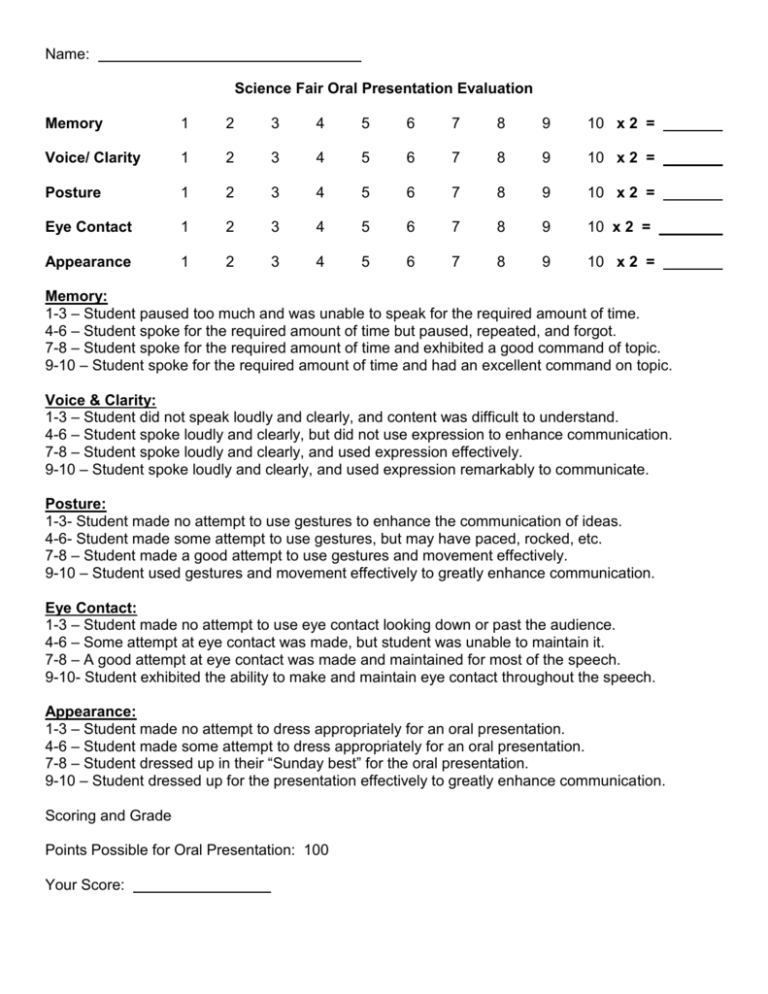
Name: Science Fair Oral Presentation Evaluation Memory 1 2 3 4 5 6 7 8 9 10 x 2 = Voice/ Clarity 1 2 3 4 5 6 7 8 9 10 x 2 = Posture 1 2 3 4 5 6 7 8 9 10 x 2 = Eye Contact 1 2 3 4 5 6 7 8 9 10 x 2 = Appearance 1 2 3 4 5 6 7 8 9 10 x 2 = Memory: 1-3 – Student paused too much and was unable to speak for the required amount of time. 4-6 – Student spoke for the required amount of time but paused, repeated, and forgot. 7-8 – Student spoke for the required amount of time and exhibited a good command of topic. 9-10 – Student spoke for the required amount of time and had an excellent command on topic. Voice & Clarity: 1-3 – Student did not speak loudly and clearly, and content was difficult to understand. 4-6 – Student spoke loudly and clearly, but did not use expression to enhance communication. 7-8 – Student spoke loudly and clearly, and used expression effectively. 9-10 – Student spoke loudly and clearly, and used expression remarkably to communicate. Posture: 1-3- Student made no attempt to use gestures to enhance the communication of ideas. 4-6- Student made some attempt to use gestures, but may have paced, rocked, etc. 7-8 – Student made a good attempt to use gestures and movement effectively. 9-10 – Student used gestures and movement effectively to greatly enhance communication. Eye Contact: 1-3 – Student made no attempt to use eye contact looking down or past the audience. 4-6 – Some attempt at eye contact was made, but student was unable to maintain it. 7-8 – A good attempt at eye contact was made and maintained for most of the speech. 9-10- Student exhibited the ability to make and maintain eye contact throughout the speech. Appearance: 1-3 – Student made no attempt to dress appropriately for an oral presentation. 4-6 – Student made some attempt to dress appropriately for an oral presentation. 7-8 – Student dressed up in their “Sunday best” for the oral presentation. 9-10 – Student dressed up for the presentation effectively to greatly enhance communication. Scoring and Grade Points Possible for Oral Presentation: 100 Your Score: Oral Presentations Now that your projects are completed, each of you will present your project to the class. If you did your project with a partner, you will give your presentation together; however, both of you should share the presentation equally. This presentation should be about 5 minutes in length, and should be a summary of your project. At the end of your presentation, you will be asked a few questions about what you learned. Questions might include, “What was your experimental variable?”, “How did you control the experiment?”, or something related to your specific topic. You will receive both a science and language arts grade for your presentation. YOUR PRESENTATION SHOULD BE ARRANGED IN THIS ORDER: A “hook” Title Summary of your aspects Purpose Hypothesis Procedure Experimental & Controlled variables Results Conclusion References EXAMPLE The title of my project is How Does Fertilizer Affect the Growth of Bean Plants? Beans are part of a group of flowering plants of the pea family. The pods of these plants are edible, and the seeds inside the pods are also referred to as “beans”. Some of the main parts of a bean plant include the roots, stems, and leaves. The roots are the part of the plant that absorbs water. In addition, they also help anchor the plant in the ground. The stem of the plant is important in that it holds the leaves up so that they can receive sunlight. The main purpose of the leaf is to produce food for the plant. This process is called photosynthesis. Most food is made in the leaves of plants; however, photosynthesis can also take place in the stem or other green parts of the plant. In this process, a plant takes in water and carbon dioxide from its environment. The green coloring, or chlorophyll in the leaves trap energy from the sunlight. This energy is used to change the water and carbon dioxide into glucose, a simple sugar. Fertilizers are often added to the soil in an effort to help plants grow. They contain the nutrients that are essential. Three of the most important nutrients are nitrogen, phosphorus, and potassium. The nitrogen is important for the healthy growth of the plant, while phosphorus is essential for the storage of energy. Like nitrogen, other elements such as potassium are necessary for proper plant growth. The purpose of my project was to see if fertilizer really does affect the growth of bean plants. Since fertilizer contains many important nutrients that plants need, my hypothesis was that it would probably help plants grow better. To test my hypothesis, I grew 40 bean plants. The first 20, I called group A. These plants were given Miracle-Gro fertilizer according to the directions on the box. The second 20 plants, I called group B. These plants were not given fertilizer. All my plants were grown for 3 Weeks. In my project, my experimental variable was fertilizer. My controlled variables were that all plants were given the same amounts of water or water fertilizer and sunlight. I also used the same kinds of seeds in both groups and all the plants were kept at the same temperature. In addition, all seeds were grown in identical containers with the same amount of soil. When measuring, I made sure all plants were measured on the same day. After 3 weeks, the plants in group A, as you can see on my graph, were an average of 12.2 cm taller than those in group B. They were also greener and healthier looking. I concluded that fertilizer does indeed help plants to grow. Fertilizer seems to not only help them grow taller, but also helps to produce all-around better plants. Here are the sources I used to find information on my topic. The book I found most helpful was Photosynthesis: How Plants Make Food by Jeffrey Higgens. I liked this book because it explained the process in a simple way, yet gave me a great deal of information. SCIENCE FAIR PROJECT EVALUATION Name: Knowledge 5 10 15 20 25 30 35 40 45 50 Scientific Method 5 10 15 20 25 30 35 40 45 50 Data/ Conclusions 5 10 15 20 25 30 35 40 45 50 Text & Organization 1 2 3 4 5 6 7 8 9 10 Graphics 1 2 3 4 5 6 7 8 9 10 Resources 1 2 3 4 5 6 7 8 9 10 Overall Presentation 2 6 8 10 12 14 16 18 4 20 Observations Demonstrated the ability to use a variety of resources to find information Self motivated and on task during class time Focused and responsible when conducting experiment Demonstrated good problem solving ability working with Power Point Cooperated well with your partner and shared responsibilities Unable to find and use appropriate information without teacher’s help Often off task and at times even disruptive Off task when conducting experiment Needed one-on-one guidance to solve most technology problems Needed help from teacher to resolve conflicts with partner Scoring and Grade Points Possible for Science Fair Project: 300 A = 200 to 180 Your Score: B = 179 to 160 C = 159 to 140 D = 139 to 120 F = 120 & less Knowledge (3 Different Aspects) A – B+ - Student demonstrates evidence of having an excellent understanding of general information related to topic on each aspect and experiment; student is able to answer questions pertaining to both. B - C+ - Student demonstrates evidence of having an adequate understanding of general information related to topic on each aspect and experiment; student is able to answer most questions pertaining to both. C - D - Student demonstrates a limited understanding of information related to topic on each aspect and experiment; student is unable to answer most questions pertaining to both. D- - F - Student does not demonstrate an understanding of information related to topic on each aspect and experiment; student is unable to answer questions related to either. Scientific Method A – B+ - Project shows an excellent understanding of scientific method; experimental design shows creativity and is appropriate to purpose. Controls are clearly evident. B - C+ - Project shows a good understanding of scientific method; experimental design is appropriate to purpose. Experiment is generally well controlled. C - D - Project shows an adequate understanding of scientific method; experimental design may or may not be appropriate to purpose; some main controls may be lacking. D- - F - Project does not show an understanding of scientific method; experimental design is not appropriate to purpose; controls are lacking. Data & Conclusions A – B+ - Data collected was appropriate and more than adequate for experiment; data was displayed in a clear and accurate manner; the number of trials was beyond the minimum number expected. Conclusions drawn are logical and based on experimental data; student can identify limitations and/or problems associated with experiment. B - C+ - Data collected was appropriate and adequate for experiment; data was displayed in a clear and accurate manner; a sufficient number of trials were used. Conclusions drawn are generally logical and based on experimental data. Student can identify some of the limitations and/or problems associated with experiment. C - D - Data collected may or may not have been appropriate or adequate for experiment; student attempted to display data in a clear and accurate manner; the number of trials was insufficient. Conclusions drawn may or may not be directly based on experiment data. Student attempted to interpret data appropriately and to identify some of the limitations and/or problems associated with experiment. D- - F - Data collected was not appropriate or adequate for experiment; data was not displayed in a clear and accurate manner; the number of trials was insufficient. Conclusions drawn are not based on experimental data; student cannot identify limitations or problems associated with experiment. Text & Organization A – B+ - Demonstrated a remarkable ability to focus on main ideas and organize information. B - C+ - Demonstrated good ability to pick out main ideas and organize information effectively. C - D - Demonstrated some ability to pick out main ideas and organize information. D- - F - Ideas were disorganized and illogical demonstrating the inability to pick out main ideas. Graphics A – B+ - Color scheme, animation, and sound used creatively, artistically, and effectively. B - C+ - Color scheme enhanced presentation, as did animation and sound effects. C - D - Acceptable color scheme, most animation and used appropriately. D- - F - Poor color scheme, inappropriate use of animation and sound. Resources A – B+ - Student used more than three resources of various types correctly cited. B - C+ - Student used three different types of resources correctly cited. C - D - Student used two different types of resources correctly cited. D- - F - Student used only one resource or only one type of resource correctly cited.
