#This program calculates the probability distributions for incidence
advertisement
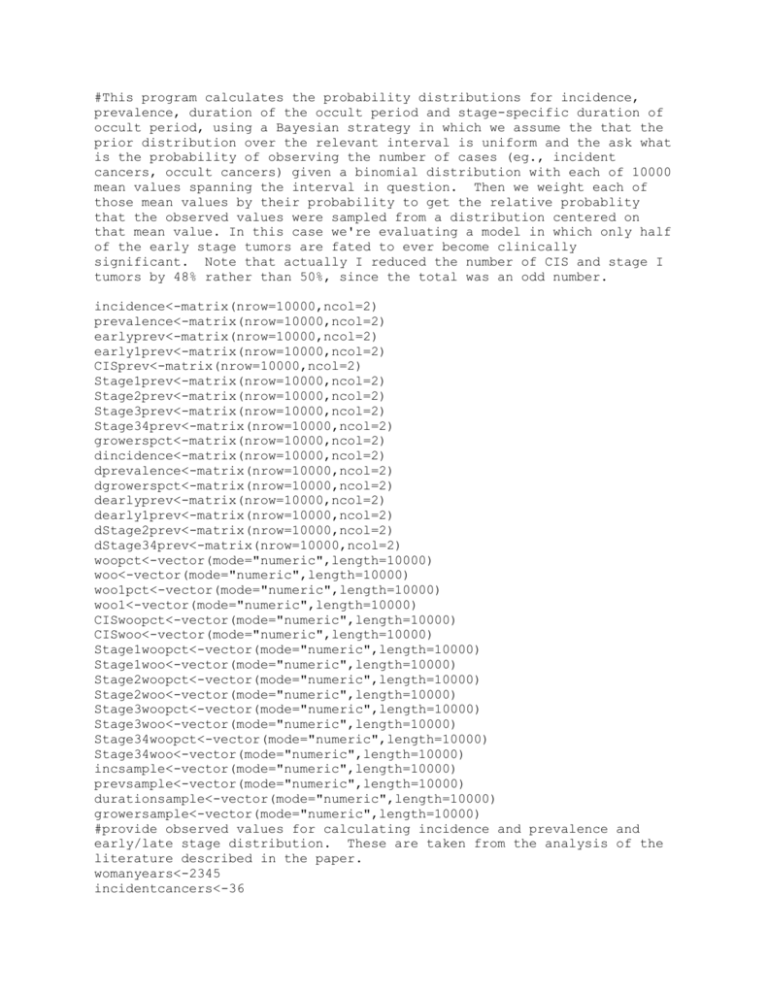
#This program calculates the probability distributions for incidence,
prevalence, duration of the occult period and stage-specific duration of
occult period, using a Bayesian strategy in which we assume the that the
prior distribution over the relevant interval is uniform and the ask what
is the probability of observing the number of cases (eg., incident
cancers, occult cancers) given a binomial distribution with each of 10000
mean values spanning the interval in question. Then we weight each of
those mean values by their probability to get the relative probablity
that the observed values were sampled from a distribution centered on
that mean value. In this case we're evaluating a model in which only half
of the early stage tumors are fated to ever become clinically
significant. Note that actually I reduced the number of CIS and stage I
tumors by 48% rather than 50%, since the total was an odd number.
incidence<-matrix(nrow=10000,ncol=2)
prevalence<-matrix(nrow=10000,ncol=2)
earlyprev<-matrix(nrow=10000,ncol=2)
early1prev<-matrix(nrow=10000,ncol=2)
CISprev<-matrix(nrow=10000,ncol=2)
Stage1prev<-matrix(nrow=10000,ncol=2)
Stage2prev<-matrix(nrow=10000,ncol=2)
Stage3prev<-matrix(nrow=10000,ncol=2)
Stage34prev<-matrix(nrow=10000,ncol=2)
growerspct<-matrix(nrow=10000,ncol=2)
dincidence<-matrix(nrow=10000,ncol=2)
dprevalence<-matrix(nrow=10000,ncol=2)
dgrowerspct<-matrix(nrow=10000,ncol=2)
dearlyprev<-matrix(nrow=10000,ncol=2)
dearly1prev<-matrix(nrow=10000,ncol=2)
dStage2prev<-matrix(nrow=10000,ncol=2)
dStage34prev<-matrix(nrow=10000,ncol=2)
woopct<-vector(mode="numeric",length=10000)
woo<-vector(mode="numeric",length=10000)
woo1pct<-vector(mode="numeric",length=10000)
woo1<-vector(mode="numeric",length=10000)
CISwoopct<-vector(mode="numeric",length=10000)
CISwoo<-vector(mode="numeric",length=10000)
Stage1woopct<-vector(mode="numeric",length=10000)
Stage1woo<-vector(mode="numeric",length=10000)
Stage2woopct<-vector(mode="numeric",length=10000)
Stage2woo<-vector(mode="numeric",length=10000)
Stage3woopct<-vector(mode="numeric",length=10000)
Stage3woo<-vector(mode="numeric",length=10000)
Stage34woopct<-vector(mode="numeric",length=10000)
Stage34woo<-vector(mode="numeric",length=10000)
incsample<-vector(mode="numeric",length=10000)
prevsample<-vector(mode="numeric",length=10000)
durationsample<-vector(mode="numeric",length=10000)
growersample<-vector(mode="numeric",length=10000)
#provide observed values for calculating incidence and prevalence and
early/late stage distribution. These are taken from the analysis of the
literature described in the paper.
womanyears<-2345
incidentcancers<-36
PBSOs<-406 #number of PBSOs suitable for prevalence estimate in BRCA1
carriers
occultcancers<-32 #number of occult cancers found in the PBSOs suitable
for prevalence estimate, in BRCA1 carriers.
#Note the sample of PBSOs used to figure the stage distribution includes
some that were excluded from prevalence estimate because of poorly
specified denominator.
alloccult<-37 #total number of occult cancers discoved by PBSO in BRCA1
carriers - note this sample of PBSOs includes some that were excluded
from prevalence estimate because of poorly specified denominator.
Allinvasive<-28
CIS<-5
Stage1<-8
Stage2<-3
Stage3<-5
Stage4<-1
Stage34<-Stage3+Stage4
Allinvasive<-Stage1+Stage2+Stage3+Stage4
allstage<-CIS+Stage1+Stage2+Stage3+Stage4#total number of occult cancers
discoved by PBSO in BRCA1 carriers that are fated to become clinically
evident (note that this number is less than the total number of occult
cancers overall (alloccult), since in this model only about half of the
early cancers ever progress to a clinically significant stage) - note
this sample of PBSOs includes some that were excluded from prevalence
estimate because of poorly specified denominator.
for (i in 1:10000)
#if the true incidence (probability of a cancer developing per womanyear) were incidence[i,1], the probability that one would diagnose 36 or
fewer cancers in 2345 women-years is incidence[i,2]. The range of values
evaluated for the true incidence was chosen to bracket the 99.99%
confidence interval.
{
incidence[i,1]<-0.7+2*i/10000
incidence[i,2]<-pbinom(incidentcancers,womanyears+1,0.007+2*i/1000000)
#if the true prevalence (probability of an occult cancer being detected
per PBSO) were prevalence[i,1], the probability that one would detect 32
or fewer cancers in 406 PBSOs is prevalence[i,2], The range of values
evaluated for the true prevalence was chosen to bracket the 99.99%
confidence interval.
prevalence[i,1]<-3.6+10*i/10000
prevalence[i,2]<-pbinom(occultcancers,PBSOs+1,0.036+10*i/1000000)
#if the true percentage of occult tumors that are early stage during the
occult period (probability of an occult cancer being CIS, stage I or
stage II when detected by PBSO) were earlyprev[i,1], the probability that
one would detect 31 or fewer early cancers among 37 cancers found by
PBSOs is earlyprev[i,2], The range of values evaluated for the true
probability of being discovered while early was chosen to bracket the
99.99% confidence interval.
earlyprev[i,1]<-40+60*i/10000
earlyprev[i,2]<-pbinom(CIS+Stage1+Stage2,allstage+1,0.4+60*i/1000000)
growerspct[i,1]<-35+60*i/10000
growerspct[i,2]<-pbinom(allstage,alloccult+1,0.35+60*i/1000000)
early1prev[i,1]<-27+60*i/10000
early1prev[i,2]<-pbinom(CIS+Stage1,allstage+1,0.27+60*i/1000000)
Stage2prev[i,1]<-50*i/10000
Stage2prev[i,2]<-pbinom(Stage2,allstage+1,50*i/1000000)
Stage34prev[i,1]<-5+60*i/10000
Stage34prev[i,2]<-pbinom(Stage34,allstage+1,0.05+60*i/1000000)
}
quartz()
plot(incidence,type="l",lwd=1,xlab="incidence
(%)",ylab="probability",main="Probability that serous cancer incidence
in BRCA1 carriers is greater than X")
quartz()
plot(prevalence,type="l",lwd=1,xlab="prevalence
(%)",ylab="probability",main="Probability that serous cancer prevalence
in BRCA1carriers is greater than X")
quartz()
plot(earlyprev,type="l",lwd=1,xlab="percent stage CIS,I or
II",ylab="probability",main="Probability that the % of occult cancers
in BRCA1 carriers that are still early stage is greater than X")
quartz()
plot(early1prev,type="l",lwd=1,xlab="percent CIS + Stage
I",ylab="probability",main="Probability that the % of occult cancers
in BRCA1 carriers that are CIS or Stage I is greater than X")
quartz()
plot(growerspct,type="l",lwd=1,xlab="percent clinically
significant",ylab="probability",main="Probability that the % of occult
cancers
in BRCA1 carriers that will be clinically
significant is greater than X")
quartz()
plot(Stage2prev,type="l",lwd=1,xlab="percent stage
II",ylab="probability",main="Probability that the % of occult cancers
in BRCA1 carriers that are Stage II is greater than X")
quartz()
plot(Stage34prev,type="l",lwd=1,xlab="percent stage
IV",ylab="probability",main="Probability that the % of occult cancers
in BRCA1 carriers that are Stage III or IV is greater than X")
for (i in 1:10000)
{
dincidence[i,1]<-0.7+2*i/10000
dincidence[i,2]<-dbinom(incidentcancers,womanyears+1,0.007+2*i/1000000)
dprevalence[i,1]<-3.6+10*i/10000
dprevalence[i,2]<-dbinom(occultcancers,PBSOs+1,0.036+10*i/1000000)
dgrowerspct[i,1]<-40+60*i/10000
dgrowerspct[i,2]<-dbinom(allstage,alloccult+1,0.4+60*i/1000000)
dearlyprev[i,1]<-40+60*i/10000
dearlyprev[i,2]<-dbinom(CIS+Stage1+Stage2,allstage+1,0.4+60*i/1000000)
dearly1prev[i,1]<-27+60*i/10000
dearly1prev[i,2]<-dbinom(CIS+Stage1,allstage+1,0.27+60*i/1000000)
dStage2prev[i,1]<-50*i/10000
dStage2prev[i,2]<-dbinom(Stage2,allstage+1,50*i/1000000)
dStage34prev[i,1]<-5+60*i/10000
dStage34prev[i,2]<-dbinom(Stage34,allstage+1,0.05+60*i/1000000)
}
quartz()
plot(dincidence,type="l",lwd=1,xlab="Incidence",ylab="Relative
Probability",main="probability density of serous cancer
incidence in BRCA1 carriers")
quartz()
plot(dprevalence,type="l",lwd=1,xlab="Prevalence",ylab="Relative
Probability",main="probability density of serous cancer
prevalence in BRCA1 carriers")
quartz()
plot(dearlyprev,type="l",lwd=1,xlab="Percent stage CIS,I or
II",ylab="Relative Probability",main="probability density of % early
stage
in BRCA1 carriers")
quartz()
plot(dgrowerspct,type="l",lwd=1,xlab="Percent clinically
significant",ylab="Relative Probability",main="probability density of %
clinically
significant in BRCA1 carriers")
quartz()
plot(dearly1prev,type="l",lwd=1,xlab="Percent CIS + Stage
I",ylab="Relative Probability",main="probability density of % CIS + Stage
I
in BRCA1 carriers")
quartz()
plot(dStage2prev,type="l",lwd=1,xlab="Percent Stage II",ylab="Relative
Probability",main="probability density of % Stage II
in BRCA1 carriers")
quartz()
plot(dStage34prev,type="l",lwd=1,xlab="Percent Stage III &
IV",ylab="Relative Probability",main="probability density of % Stage III
& IV combined
in BRCA1 carriers")
irand10000<-runif(10000,min=0,max=1)
prand10000<-runif(10000,min=0,max=1)
erand10000<-runif(10000,min=0,max=1)
e1rand10000<-runif(10000,min=0,max=1)
growerrand10000<-runif(10000,min=0,max=1)
Stage1rand10000<-runif(10000,min=0,max=1)
Stage2rand10000<-runif(10000,min=0,max=1)
Stage34rand10000<-runif(10000,min=0,max=1)
for (i in 1:10000)
for (j in 1:10000)
if (incidence[j,2]>irand10000[i])incsample[i]<-incidence[j,1] else break
#incidence:
summary(incsample,digits=2)
quantile(incsample,0.025)
quantile(incsample,0.975)
for (i in 1:10000)
for (j in 1:10000)
if (prevalence[j,2]>prand10000[i])prevsample[i]<-prevalence[j,1] else
break
#prevalence:
summary(prevsample,digits=2)
quantile(prevsample,0.025)
quantile(prevsample,0.975)
for (i in 1:10000)
for (j in 1:10000)
if (growerspct[j,2]>growerrand10000[i])growersample[i]<-growerspct[j,1]
else break
#Fraction of occult cancers that will ever become clinically significant:
summary(growersample,digits=2)
quantile(growersample,0.025)
quantile(growersample,0.975)
for (i in 1:10000)
for (j in 1:10000)
if (earlyprev[j,2]>erand10000[i])woopct[i]<-earlyprev[j,1] else break
#duration of early-stage (CIS, Stage I & Stage II) occult period - window
of opportunity as a fraction of total occult period:
summary(woopct,digits=2)
quantile(woopct,0.025)
quantile(woopct,0.975)
for (i in 1:10000)
for (j in 1:10000)
if (early1prev[j,2]>e1rand10000[i])woo1pct[i]<-early1prev[j,1] else break
#duration of earliest-stage (CIS, Stage I) occult period - window of
opportunity as a fraction of total occult period:
summary(woo1pct,digits=2)
quantile(woo1pct,0.025)
quantile(woo1pct,0.975)
durationsample<-prevsample*growersample/(incsample*100)
#duration of entire occult period for tumors that will become clinically
significant:
summary(durationsample)
quantile(durationsample,0.025)
quantile(durationsample,0.975)
woo<-woopct*durationsample/100
#duration of early (CIS, Stage I & Stage II) occult period - window of
opportunity:
summary(woo,digits=2)
quantile(woo,0.025)
quantile(woo,0.975)
woo1<-woo1pct*durationsample/100
#duration of earliest (CIS, Stage I) occult period:
summary(woo1,digits=2)
quantile(woo1,0.025)
quantile(woo1,0.975)
for (i in 1:10000)
for (j in 1:10000)
if (Stage2prev[j,2]>Stage2rand10000[i])Stage2woopct[i]<-Stage2prev[j,1]
else break
#duration of Stage II occult period as a fraction of total occult period:
summary(Stage2woopct,digits=2)
quantile(Stage2woopct,0.025)
quantile(Stage2woopct,0.975)
Stage2woo<-Stage2woopct*durationsample/100
#duration of Stage II occult period as a fraction of total occult period:
summary(Stage2woo,digits=2)
quantile(Stage2woo,0.025)
quantile(Stage2woo,0.975)
for (i in 1:10000)
for (j in 1:10000)
if (Stage34prev[j,2]>Stage34rand10000[i])Stage34woopct[i]<Stage34prev[j,1] else break
#duration of late (Stage III + Stage IV) occult period as a fraction of
total occult period:
summary(Stage34woopct,digits=2)
quantile(Stage34woopct,0.025)
quantile(Stage34woopct,0.975)
Stage34woo<-Stage34woopct*durationsample/100
#duration of late (Stage III + Stage IV) occult period as a fraction of
total occult period:
summary(Stage34woo,digits=2)
quantile(Stage34woo,0.025)
quantile(Stage34woo,0.975)
lateoccult<-(100-woopct)*durationsample/100
#duration of late (Stage III + Stage IV) occult period:
summary(lateoccult,digits=2)
quantile(lateoccult,0.025)
quantile(lateoccult,0.975)
library(lattice)
quartz()
densityplot(durationsample, type="l",xlab="Duration of occult period
(years)", ylab="Relative Probability",main="Probability density plot of
average duration of clinically significant serous cancer")
quartz()
densityplot(woo, type="l",xlab="Years occult and CIS, Stage I or Stage
II", ylab="Relative Probability",main="Probability density plot of
average duration
of early-stage occult period in BRCA1 carriers", col="darkgreen")
quartz()
densityplot(woo1, type="l",xlab="Years occult and CIS or Stage I",
ylab="Relative Probability",main="Probability density plot of average
duration of CIS + Stage I occult period
in BRCA1 carriers", col="magenta")
quartz()
densityplot(Stage2woo, type="l",xlab="Years occult and Stage II",
ylab="Relative Probability",main="Probability density plot of average
duration of Stage II occult period
in BRCA1 carriers", col="purple")
quartz()
densityplot(Stage34woo, type="l",xlab="Years occult and Stage III or
Stage IV", ylab="Relative Probability",main="Probability density plot of
average
duration of Stage III & Stage IV occult period
in BRCA1 carriers", col="tomato")
