Quantitative Analysis (CHM 235)
advertisement
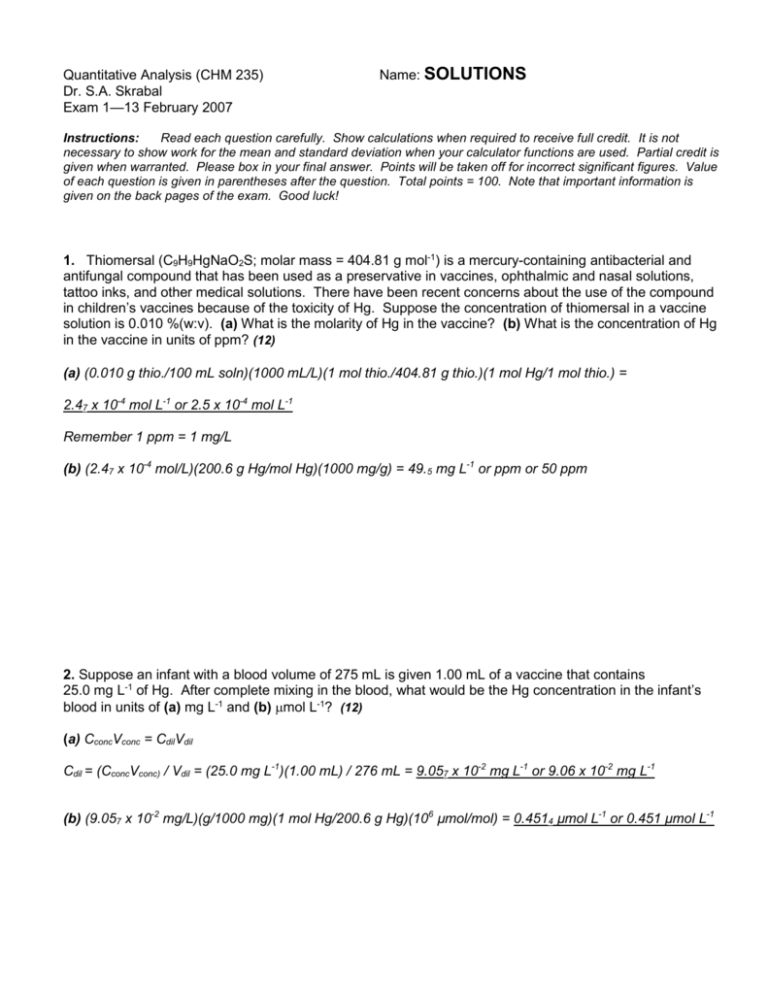
Quantitative Analysis (CHM 235) Dr. S.A. Skrabal Exam 1—13 February 2007 Name: SOLUTIONS Instructions: Read each question carefully. Show calculations when required to receive full credit. It is not necessary to show work for the mean and standard deviation when your calculator functions are used. Partial credit is given when warranted. Please box in your final answer. Points will be taken off for incorrect significant figures. Value of each question is given in parentheses after the question. Total points = 100. Note that important information is given on the back pages of the exam. Good luck! 1. Thiomersal (C9H9HgNaO2S; molar mass = 404.81 g mol-1) is a mercury-containing antibacterial and antifungal compound that has been used as a preservative in vaccines, ophthalmic and nasal solutions, tattoo inks, and other medical solutions. There have been recent concerns about the use of the compound in children’s vaccines because of the toxicity of Hg. Suppose the concentration of thiomersal in a vaccine solution is 0.010 %(w:v). (a) What is the molarity of Hg in the vaccine? (b) What is the concentration of Hg in the vaccine in units of ppm? (12) (a) (0.010 g thio./100 mL soln)(1000 mL/L)(1 mol thio./404.81 g thio.)(1 mol Hg/1 mol thio.) = 2.47 x 10⁻⁴ mol L-1 or 2.5 x 10⁻⁴ mol L-1 Remember 1 ppm = 1 mg/L (b) (2.47 x 10⁻⁴ mol/L)(200.6 g Hg/mol Hg)(1000 mg/g) = 49.5 mg L-1 or ppm or 50 ppm 2. Suppose an infant with a blood volume of 275 mL is given 1.00 mL of a vaccine that contains 25.0 mg L-1 of Hg. After complete mixing in the blood, what would be the Hg concentration in the infant’s blood in units of (a) mg L-1 and (b) mol L-1? (12) (a) CconcVconc = CdilVdil Cdil = (CconcVconc) / Vdil = (25.0 mg L-1)(1.00 mL) / 276 mL = 9.057 x 10⁻² mg L-1 or 9.06 x 10⁻² mg L-1 (b) (9.057 x 10⁻² mg/L)(g/1000 mg)(1 mol Hg/200.6 g Hg)(106 µmol/mol) = 0.4514 µmol L-1 or 0.451 µmol L-1 3. A new forensic chemist is learning a technique for determining cocaine in hair for use in criminal investigations. Prior to analyzing real forensic samples, she is given a certified reference material that contains 0.250 mg L-1 cocaine. She analyzes the solution eight times, obtaining the following results (in mg L-1): 0.239, 0.245, 0.231, 0.219, 0.252, 0.244, 0.253, 0.247. (a) Using the Q-test at the 90% confidence level, determine whether or not any outliers can be rejected from this data set. (5) 0.219, 0.231, 0.239, 0.244, 0.245, 0.247, 0.252, 0.253 0.219 is the possible outlier Qcalc = gap/range = (0.231 – 0.219)/(0.253-0.219) = 0.353 Qtable(90%CL, n = 8) = 0.468. Since Qcalc < Qtable, data point can not be rejected at the 90% CL. (b) Calculate the mean, standard deviation, and % relative standard deviation of the acceptable data. (9) Use all data. Using calculator: Mean = 0.2412 mg L-1 - Looking at std. dev. and considering “real rule” of sig. figs., the mean is rounded to 0.241 mg L-1 Std. dev. = 0.011 mg L-1 %rsd = (std. dev./mean) 100 = (0.011/0.241)100 = 4.5% or 5% (c) Determine whether or not the new forensic chemist is obtaining results which are significantly different from the certified value at the 95% confidence level. (10) t calc known value x s n 0.250 0.241 0.011 8 2.314 df = n – 1 = 8 – 1 = 7. t(95% CL, df = 7) = 2.365 Since tcalc < ttable, there is no significant difference between the certified value and the chemist’s result. (d) Calculate the 90% confidence interval for the acceptable data. (6) df = n – 1 = 8- 1 = 7 t(90% CL, df = 7) = 1.895 0.241 mg L1 (1.895)(0.011 ) 8 0.241 0.007 3 mg L1 2 4. A known cocaine user was arrested a few hours after a felony crime had been discovered. Hair found at the crime scene was suspected to have come from the head of the arrested individual. After receiving the suspect’s consent, samples of hair from the crime scene and from the suspect’s head were analyzed for cocaine content at the crime lab. Results of the analyses are tabulated below: Source of hair Crime scene Suspect’s head Mean (ng mg-1) 30.23 28.5 n 4 6 Std. dev. (ng mg-1) 0.98 1.2 (a) Use the F test to determine whether or not the standard deviations of the two data sets are different at the 95% confidence level. (5) Fcalc s12 s 22 (1.2 ) 2 (0.9 8 ) 2 1.499 df = (6 -1) = 5 for s1 and (4- 1) = 3 for s2. F(df = 5,3; 95% CL) = 9.01 Since Fcalc < Ftable, the standard deviations are not significantly different at the 95% CL. (b) Use a t test to determine whether or not the means of the two data sets are significantly different at the 95% confidence level. (10) s pooled t calc s12 (n1 1) s 22 (n2 1) n1 n2 2 x1 x 2 n1 n2 s pooled n1 n2 (1.2 ) 2 (6 1) (0.9 8 ) 2 (4 1) 642 28.5 30.2 3 1.12256 (6)( 4) 64 1.12256 2.387 df = n1 + n2 -2 = 6 + 4 – 2 = 8 t(95% CL, df = 8) = 2.306 Since tcalc > ttable, means are significantly different at the 95% CL. 5. Suppose you are weighing an extract of a natural product on a balance whose absolute uncertainty is 0.00001 g. What is the minimum mass of the natural product that you must weigh if you are to have a relative uncertainty in your mass of not more than 0.5%? (10) relative uncertainty = (absolute uncertainty/measurement) 100 measurement = (absolute uncertainty/relative uncertainty) 100 measurement = (0.00001 g / 0.5) 100 = 0.002 g 3 6. Concentrations of dissolved zinc were analyzed in samples from a lake using graphite furnace atomic absorption spectrometry. Standard concentrations ranged from 0 to 60.0 nM. The data were analyzed using the LINEST function in Excel®, and the following unedited parameters of the regression were calculated: slope: 0.002588 ± 0.0000222 y-intercept: 0.0016011 ± 0.0005773 std. dev. of y values: 0.0018101 An unknown sample was analyzed, yielding an absorbance of 0.057. The blank was found to be 0.002. (A) Write the linear regression equation in the form y (± sy) = m (± sm) x + b (± sb) using the correct number of significant figures. (5) y (± 0.0018) = 0.002588 (± 0.000022) x + 0.00160 (± 0.00057) (B) Determine the Zn concentration (in nM) of the unknown. (8) Blank-corrected absorbance = 0.057 – 0.002 = 0.055 x = (y – b) / m = (0.055 – 0.00160) / 0.002588 = 20.6 or 21 nM (We will use uncertainty analysis to figure out how many sig. figs we should keep.) (C) Determine the absolute and relative uncertainties of the Zn concentration in the unknown. (8) x ( s x ) 0.055 ( 0.0018 ) 0.0016 0 ( 0.00057 ) 0.002588 ( 0.00002 2 ) enum (0.0018 ) 2 (0.00057 ) 2 0.0018 %enum 0.0018 (100) 3.3 % (0.055 0.0016 0 ) %edenom 0.00002 2 (100) 0.85 % 0.002588 %eoveerall (3.3%) 2 (0.85 %) 2 3.4 % (3.4%)(20.6 nM) = (0.034)(20.6 nM) = 0.70 nM Use the uncertainty to round correctly: 20.6 ± 0.70 or 0.7 nM and 20.6 nM ± 3.4 or 3% 4 Useful information ( xi x ) 2 Standard deviation: s Average deviation: d s 100 x %RSD = i n 1 x i x Relative avg. dev. (rad) = i Confidence interval: x n ts d 100 x where df = n – 1. n Comparison of means (when standard deviations are not significantly different): t calc x1 x 2 n1 n2 s pooled n1 n2 s pooled s12 (n1 1) s 22 (n2 1) n1 n2 2 where degrees of freedom = n1 + n2 - 2 Comparison of means (when standard deviations are significantly different): t calc x1 x 2 s12 / n1 s 22 / n2 DF ( s12 / n1 s 22 / n2 ) 2 2 2 ( s 22 / n2 ) 2 ( s1 / n1 ) n1 1 n2 1 Comparing measured result to known result: t calc 2 known value x s n where degrees of freedom = n – 1. Fcalc s12 2 s2 where s1 > s2 and degrees of freedom is n1 – 1 and n2 -1 en e12 e22 e32 ... en21 %en %e12 %e22 %e32 ... %en21 y = mx + b Q = gap/range 5
