Brought to you by the insurance specialists at
IPG Employee Benefits
Prescription Drug Trends
Prescription drugs are a vital part of health care plans, and it is
important for employers to understand the trends beyond
prescription drug costs and what they can do to manage those
costs.
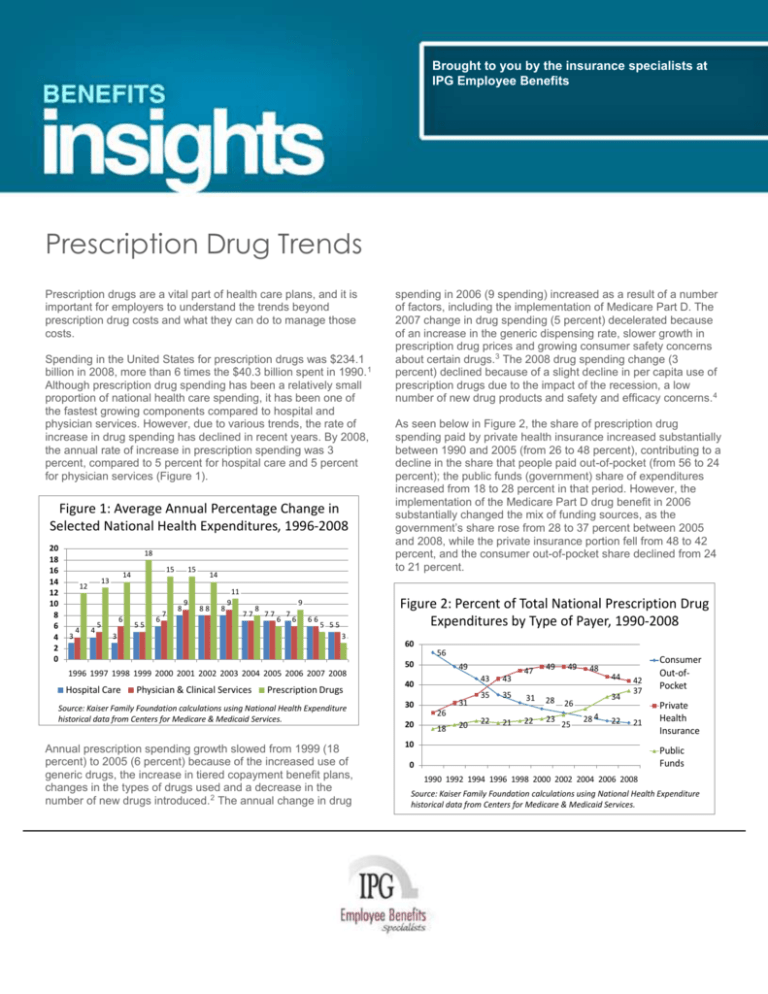
Spending in the United States for prescription drugs was $234.1
billion in 2008, more than 6 times the $40.3 billion spent in 1990. 1
Although prescription drug spending has been a relatively small
proportion of national health care spending, it has been one of
the fastest growing components compared to hospital and
physician services. However, due to various trends, the rate of
increase in drug spending has declined in recent years. By 2008,
the annual rate of increase in prescription spending was 3
percent, compared to 5 percent for hospital care and 5 percent
for physician services (Figure 1).
Figure 1: Average Annual Percentage Change in
Selected National Health Expenditures, 1996-2008
20
18
16
14
12
10
8
6
4
2
0
18
3
4
4
15
14
13
12
6
5
55
6
7
15
8
9
14
88
8
11
9
77
3
8
6
7
6
66
As seen below in Figure 2, the share of prescription drug
spending paid by private health insurance increased substantially
between 1990 and 2005 (from 26 to 48 percent), contributing to a
decline in the share that people paid out-of-pocket (from 56 to 24
percent); the public funds (government) share of expenditures
increased from 18 to 28 percent in that period. However, the
implementation of the Medicare Part D drug benefit in 2006
substantially changed the mix of funding sources, as the
government’s share rose from 28 to 37 percent between 2005
and 2008, while the private insurance portion fell from 48 to 42
percent, and the consumer out-of-pocket share declined from 24
to 21 percent.
Figure 2: Percent of Total National Prescription Drug
Expenditures by Type of Payer, 1990-2008
9
77
spending in 2006 (9 spending) increased as a result of a number
of factors, including the implementation of Medicare Part D. The
2007 change in drug spending (5 percent) decelerated because
of an increase in the generic dispensing rate, slower growth in
prescription drug prices and growing consumer safety concerns
about certain drugs.3 The 2008 drug spending change (3
percent) declined because of a slight decline in per capita use of
prescription drugs due to the impact of the recession, a low
number of new drug products and safety and efficacy concerns. 4
5 55
3
60
56
50
49
1996 1997 1998 1999 2000 2001 2002 2003 2004 2005 2006 2007 2008
Hospital Care
Physician & Clinical Services
Prescription Drugs
Source: Kaiser Family Foundation calculations using National Health Expenditure
historical data from Centers for Medicare & Medicaid Services.
Annual prescription spending growth slowed from 1999 (18
percent) to 2005 (6 percent) because of the increased use of
generic drugs, the increase in tiered copayment benefit plans,
changes in the types of drugs used and a decrease in the
number of new drugs introduced.2 The annual change in drug
40
30
20
31
26
18
20
43
43
35
35
22
21
47
49
31
28
22
23
49
48
34
26
25
44
2824
22
42
37
21
10
Consumer
Out-ofPocket
Private
Health
Insurance
Public
Funds
0
1990 1992 1994 1996 1998 2000 2002 2004 2006 2008
Source: Kaiser Family Foundation calculations using National Health Expenditure
historical data from Centers for Medicare & Medicaid Services.
Notes on Figure 2: “Consumer Out-of-Pocket” includes spending
by consumers for health care services not covered by a health
plan and cost-sharing amounts (coinsurance, copayments,
deductibles) from public and private health plans. It does not
include consumer premium payments and cost sharing paid by
supplementary Medicare policies, which are included in the
Private Health Insurance category.
Medicare’s and Medicaid’s shares of public funding changed
when the Medicare drug benefit took effect in 2006. Between
2005 and 2008, Medicare’s share grew from 7 to 60 percent, and
Medicaid’s share fell from 70 to 24 percent (Figure 3), because
Medicare replaced Medicaid as the primary source of drug
coverage for beneficiaries with coverage under both programs.
Figure 3: Distribution of Total Public Prescription
Drug Expenditures by Type of Payer, 2005 & 2008
Price. Prescription drug prices increased 3.4 percent in 2009, 2.5
percent in 2008, 1.4 percent in 2007 and 4.3 percent in 2006.
The average annual growth in prescription drug prices from 2000
to 2009 was 3.6 percent, compared to 4.1 percent for all medical
care and 2.5 percent for all items.8
Changes in Types of Drugs Used. Prescription drug spending is
affected when new drugs enter the market and when existing
medications lose patent protection. New drugs can either
increase or decrease overall drug spending, depending on price
and how the new drug relates to existing drugs on the market
(replaces something, is a new treatment, adds competition, etc.).
Drug spending is also typically reduced when brand name drugs
lose patent protection and face competition from new, cheaper
generic substitutes. FDA analysis of 1999-2004 data shows that
for products with a large number of generics, the average generic
price falls to 20 percent and lower of the branded price.9 Several
high-sales brand name drugs are expected to go off-patent in the
next five years. New competition from generic drugs may bring
down costs for patients.10
23%
2005
Sales and Profitability. Prescription drug sales were $300.3 billion
in 2009, an increase of 5.1 percent over 2008. This increase was
over double the 1.9 percent increase from 2007 to 2008. IMS
Health attributes the 2009 growth to various factors including
stronger demand, manufacturing pricing practices, greater use of
specialty drugs and fewer product safety issues.11 IMS Health
forecasts a 3 to 6 percent annual growth in the U.S.
pharmaceutical market in the next five years.12
70%
7%
16%
2008
25%
60%
0%
10%
20%
Other Public
30%
40%
50%
Medicaid
60%
70%
80%
Medicare
Source: Kaiser Family Foundation calculations using National Health Expenditures
historical data from Centers for Medicare & Medicaid Services.
Factors Driving Changes
A number of factors contribute to changes in prescription drug
costs.
Increased Utilization. The number of prescriptions dispensed in
the United States in 2009 increased 2.1 percent, a larger growth
rate than the 1.0 percent increase in 2008 over 2007. From 1999
to 2009, the number of prescriptions increased 39 percent,
compared to a U.S. population growth of 9 percent. 5
Lack of Adherence. A recent study found that the rate of unfilled
prescriptions has increased. Together, health plan denials and
patient abandonment resulted in 14.4 percent of all new,
commercial plan prescriptions going unfilled in 2009, up 5.5
percent from 2008.6 A 2009 study found that drug-related
morbidity, including poor adherence (not taking medication as
prescribed by doctors) and suboptimal prescribing, drug
administration and diagnosis, costs as much as $289 billion
annually, about 13 percent of total health care expenditures. 7
PPACA Changes Affecting the Pharmaceutical Industry. The
Patient Protection and Affordable Care Act, enacted March 23,
2010, includes several provisions that affect the pharmaceutical
industry:
Imposes an annual fee on certain manufacturers and importers
of brand name drugs whose branded sales exceed $5 million.
Establishes a process for FDA licensure of biosimilar (i.e.,
interchangeable) versions of brand name drug; drugs are
granted 12 years of exclusivity before biosimilar versions of a
drug can be approved.
Changes certain drug labeling requirements and requires the
HHS Secretary to determine whether adding certain
information to a prescription drug’s labeling and advertising
would improve health care decision-making.
Insurance Coverage
Lack of insurance coverage for prescription drugs can have
adverse effects, including not filling prescriptions or skipping
doses because of cost. Prescription drug coverage comes from a
variety of private and public sources, including employer
coverage, individually purchased policies, Medicare and
Medicaid.
PPACA Changes Affecting Prescription Drug Coverage. PPACA
provisions affecting prescription drug coverage include:
This Benefits Insights is not intended to be exhaustive nor should any discussion or opinions be construed as professional advice.
Design © 2011 Zywave, Inc. All rights reserved.
Significant expansion of coverage to the uninsured. PPACA
provides that prescription drugs are one of the “essential health
benefits” that must be included in health plans in the new
Health Benefit Exchanges and in the benchmark benefit
package or benchmark-equivalent for newly eligible adults
under Medicaid.
Discounts and Rebates. Private and public drug programs
negotiate with pharmaceutical manufacturers (often using
contracted organizations known as pharmacy benefit managers)
to receive discounts and rebates which are applied based on
volume, prompt payment and market share.
Rebates, discounts and other benefits for certain Medicare
Part D beneficiaries over the next several years
Medicaid. Historically, prescription drugs have been one of the
fastest-growing Medicaid services. Medicaid spent $19.4 billion
for prescription drugs in 2008, an increase of 3.5 percent over
2007.16
Response
A variety of public and private strategies have been implemented
to try to contain rising prescription drug costs.13
Utilization Management Strategies. Health plans have responded
to rising prescription drug costs by increasing enrollee costsharing amounts, using formularies to exclude certain drugs from
coverage, applying quantity dispensing limits, requiring prior
authorization and using step therapy (starting with the most costeffective drug and progressing to more costly therapy only if
necessary). In 2009, over three-quarters of workers with
employer-sponsored coverage were in plans with three or more
tiers of cost sharing for prescription drugs, almost 3 times the
proportion in 2000 (27 percent).14 Figure 4 shows worker
copayment amounts for three- and four-tier structures.
Dollars
Figure 4: Among Covered Workers with Three- or Four-Tier
Prescription Drug Cost Sharing, Average Copayments, 2000-2009
90
80
70
60
50
40
30
20
10
0
85
75
59 59
8 9 10 11 10 10
15 18
Generic
2000
22 25
32
26 27 29
Preferred
2002
2004
38
43 46 46
Nonpreferred
2006
2008
Fourth-Tier*
Medicaid requires drug manufacturers who want to sell their
products to Medicaid patients to agree to pay rebates to states
for outpatient drugs purchased on behalf of Medicaid
beneficiaries. PPACA increases the Medicaid drug rebate
percentages for several types of outpatient drugs and requires
that the resulting savings be remitted to the federal government.
Medicare. The Medicare Part D drug benefit shifted spending
from the private sector and Medicaid to Medicare, making
Medicare the nation’s largest public payer of prescription drugs
(from 7 percent in 2005 to 60 percent in 2008). Medicare
prescription drug spending as a share of total U.S. prescription
spending rose from 2 percent in 2005 to 22 percent in 2008.
Medicare prescription drug spending totaled $52.1 billion in 2008,
an increase of 13 percent over 2007.17
Purchasing Pools. Some public and private organizations have
banded together to form prescription drug purchasing pools
which increase their purchasing power through higher volume
and shared expertise.18
Consumers. Consumers are turning to a variety of methods to
reduce their prescription costs,19 including requesting cheaper
drugs or generic drugs, using the Internet and other sources to
make price comparisons, using the Internet to purchase drugs,
buying at discount stores, buying over-the-counter instead of
prescribed drugs, buying drugs in bulk and pill-splitting, using
mail-order pharmacies20 and using pharmaceutical company or
state drug assistance programs.
2009
Source: Kaiser/HRET Survey of Employer-Sponsored Health Benefits, 2000-2009, Exhibit 9.4
*Fourth-tier drug copay information was not obtained prior to
2004.
A 2009 survey of individually purchased health policies found that
the vast majority had drug benefits, with copayments being the
predominant form of cost sharing. All HMOs and the majority of
PPO/POS policies charged copayments which averaged,
respectively, $10/$13 for generic drugs, $26/$28 for preferred
brand name drugs, and $44/$48 for nonformulary drugs. Fewer
than half of the PPO/POS policies had a prescription drug
deductible, while over half of the HMOs had a drug deductible. 15
Importation. The high cost of prescriptions has led some to
suggest that individuals be permitted to purchase prescription
products from distributors in Canada or other countries (it is
currently illegal, though it does still happen). Importation issues
such as actual savings amounts, drug safety, and marketplace
competition and pricing continue to be debated.
Outlook
HHS projects U.S. prescription drug spending to increase from
$234.1 billion in 2008 to $457.8 billion in 2019, almost doubling
over the 11-year period. The average annual increase in drug
spending from the previous year is projected to increase from 3.2
percent in 2008 to 5.2 percent in 2009, and then rise to 7.3
percent in 2019 (reflecting increases in drugs prices, the number
of new drug approvals and the share of expensive specialty
This Benefits Insights is not intended to be exhaustive nor should any discussion or opinions be construed as professional advice.
Design © 2011 Zywave, Inc. All rights reserved.
drugs). Drug spending as a percent of overall national health
spending is projected to increase somewhat from 10.0 percent in
2008 to 10.2 percent in 2019.21
In the coming years, implementation of various provisions of
PPACA will affect prescription drug coverage, utilization, prices
and regulation.
Coverage and utilization of prescription drugs will be expanded
by PPACA’s:
o Health insurance mandate and premium and cost-sharing
subsidies
o Designation of prescription drugs as an essential health
benefit to be covered by private health plans through the
new Health Benefit Exchanges and by Medicaid for newly
eligible adults
o Medicare prescription drug rebate, cost-sharing and
catastrophic threshold changes.
Prices charged to government programs will be affected by
changes to Medicaid rebate requirements and expansions to
the Section 340B program.
Prescription drug regulation will be affected by the new
process for licensure of biosimilar versions of brand name
biological products and by drug labeling requirements.
These and other PPACA changes will ultimately impact national
spending for prescription drugs in ways yet to be seen.
Reprinted with Permission from the Kaiser Family Foundation.
The Henry J. Kaiser Family Foundation is a non-profit, private
operating foundation dedicated to providing information and
analysis on health care issues to policymakers, the media, the
health care community, and the general public. The Foundation
is not associated with Kaiser Permanente or Kaiser Industries.
_____________________________________
1 All spending amounts in this report are in current dollars (i.e., not
adjusted for inflation.)
2 Aaron Catlin et al., “National Health Spending In 2005: The Slowdown
Continues, “Health Affairs 26, no. 1 (January/February 2007)142-153.
3 Micah Hartman et al., “National Health Spending In 2007: Slower Drug
Spending Contributes To Lowest Rate Of Overall Growth Since 1998,”
Health Affairs 28, no. 1 (January/February 2009) 246-261.
4 Micah Hartman et al., “Health Spending Growth At A Historic Low In
2008,” Health Affairs 29, no. 1 (January 2010)147-155.
5 Kaiser Family Foundation calculations using data from IMS Health,
www.imshealth.com (Press Room, US Top-Line Industry Data 2008), and
Census Bureau, www.census.gov. The per capita number may differ from
the number reported at KFF’s website www.statehealthfacts.org because
of differing data sources which use different retail pharmacy definitions
(e.g., IMS Health includes mail order, Verispan does not).
7 New England Healthcare Institute, Thinking Outside the Pillbox: A
System-wide Approach to Improving Patient Medication Adherence for
Chronic Disease (August 2009),
www.nehi.net/publications/44/thinking_outside_the_pillbox_a_systemwid
e_approach_to_improving_patient_medication_adherence_for_chronic_d
isease.
8 Kaiser Family Foundation analysis of Consumer Price Index, All Urban
Consumers, U.S. City Average, not seasonally adjusted,
www.bls.gov/cpi/home.htm, accessed April 28, 2010.
9 US Food and Drug Administration, Center for Drug Evaluation and
Research, “Generic Competition and Drug Prices,”
www.fda.gov/AboutFDA/CentersOffices/CDER/ucm129385.htm,
accessed March 12, 2010.
10 IMS Health, “IMS Forecasts Global Pharmaceutical Market Growth of
5-8% Annually Through 2014; Maintains Expectations of 4-6% Growth in
2010,” April 20, 2010, www.imshealth.com (Press Room, Press
Releases).
11 IMS Health, “IMS Health Reports U.S. Prescription Sales Grew 5.1
Percent in 2009, to $300.3 Billion” (April 1, 2010), online at
www.imshealth.com (Press Room, Press Releases).
12 IMS Health Press Release, ibid., April 20, 2010.
13 See also Kaiser Family Foundation, Cost Containment Strategies For
Prescription Drugs: Assessing The Evidence In the Literature (March
2005),
www.kff.org/rxdrugs/loader.cfm?url=/commonspot/security/getfile.cfm&Pa
geID=51885.
14 Kaiser Family Foundation and Health Research and Educational
Trust, op. cit., Ex. 9.1,
http://ehbs.kff.org/?page=charts&id=2&sn=24&ch=1136.
15 America’s Health Insurance Plans, Center for Policy and Research,
Individual Health Insurance 2009: A Comprehensive Survey of
Premiums, Availability, and Benefits (October 2009),
www.ahipresearch.org/pdfs/2009IndividualMarketSurveyFinalReport.pdf.
16 Centers for Medicare and Medicaid Services, Office of the Actuary,
National Health Statistics Group, at
www.cms.hhs.gov/NationalHealthExpendData/.
17 Ibid.
18 National Conference of State Legislatures, “Pharmaceutical Bulk
Purchasing: Multi-state and Inter-agency Plans, 2008 edition” (Updated
May 8, 2008), www.ncsl.org/programs/health/bulkrx.htm.
19 Devon Herrick, National Center for Policy Analysis, Shopping for
Drugs: 2004, National Center for Policy Analysis, Policy Report No. 270
(October 2004), www.ncpa.org/pub/st/st270.
20 US mail services sales have increased 54 percent since 2003, though
their share of total US prescription sales has increased only slightly -2007: $44.6 billion in sales, 16 percent of total prescription sales; 2003:
$28.9 billion in sales, 13 percent of total prescription sales. IMS Health,
www.imshealth.com (About Us, Press Room, US Top-Line Industry Data,
2007 U.S).
21 Christopher J. Truffer et al. ”Health Spending Projections Through
2019: The Recession’s Impact Continues,” Health Affairs 29, no.3 (March
2010), 522-529.
6 Wolters Kluwer Pharma Solutions, Inc., Pharma Insight 2009: Patients
take More Power Over Prescription Decisions (March 2010),
www.wolterskluwerpharma.com/Press/Pharma%20Insight%202009%20%20Media.pdf.
This Benefits Insights is not intended to be exhaustive nor should any discussion or opinions be construed as professional advice.
Design © 2011 Zywave, Inc. All rights reserved.

