Development and clinical application of a
advertisement
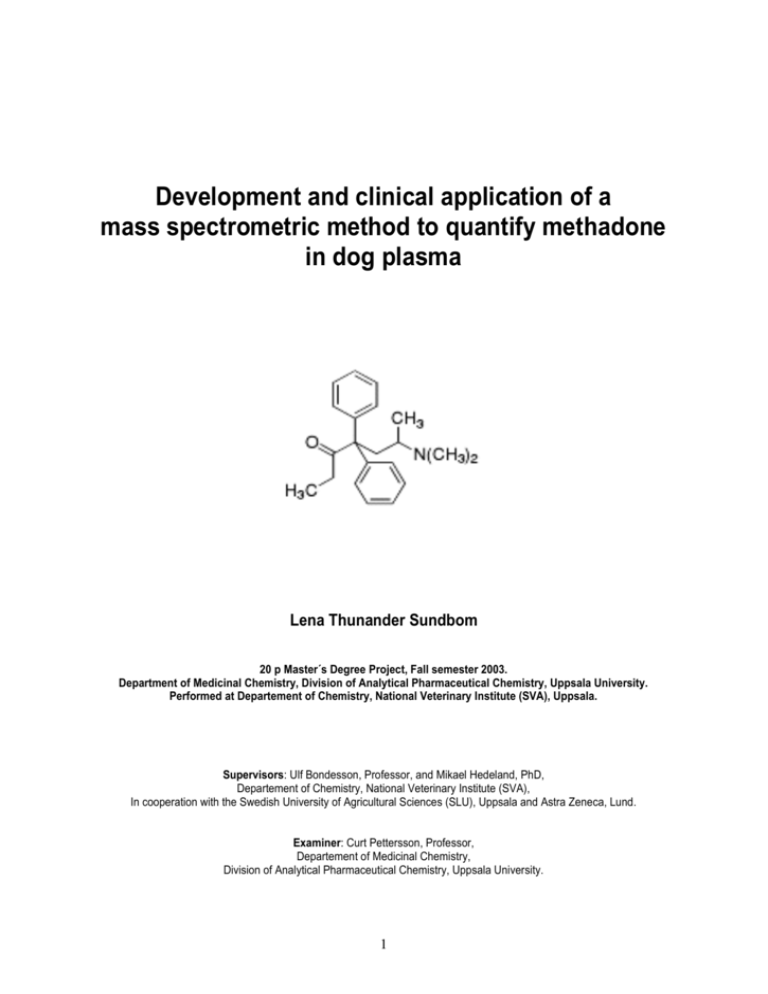
Development and clinical application of a mass spectrometric method to quantify methadone in dog plasma Lena Thunander Sundbom 20 p Master´s Degree Project, Fall semester 2003. Department of Medicinal Chemistry, Division of Analytical Pharmaceutical Chemistry, Uppsala University. Performed at Departement of Chemistry, National Veterinary Institute (SVA), Uppsala. Supervisors: Ulf Bondesson, Professor, and Mikael Hedeland, PhD, Departement of Chemistry, National Veterinary Institute (SVA), In cooperation with the Swedish University of Agricultural Sciences (SLU), Uppsala and Astra Zeneca, Lund. Examiner: Curt Pettersson, Professor, Departement of Medicinal Chemistry, Division of Analytical Pharmaceutical Chemistry, Uppsala University. 1 ABSTRACT 3 INTRODUCTION 4-5 MATERIALS AND METHODS 6-8 Chemicals 6 Instrumentation 6 Plasma samples 6 Sample pre-treatment (extraction procedure) 6 Gas chromatographic and mass spectrometric procedure 7 Standard solutions and calibrations 7 Analysis 7 Validation 7-8 RESULTS AND DISCUSSION 9-15 Method development 9-13 Extraction procedure Gas chromatographic and mass-spectrometric procedure Validation 9 9-10 11-13 Bioanalysis of dog plasma 13-15 CONCLUSION 15 REFERENCES 16 2 ABSTRACT A liquid-liquid extraction method and a gas chromatographic method with chemical ionization tandem mass spectrometric detection was developed and validated to quantify methadone in dog plasma. Validation parameters evaluated was: limit of detection, limit of quantification, stability in plasma, stability of extracts, selectivity, precision and accuracy. The method was adequate to quantify methadone in dog plasma at concentrations above 2.2ng/ml (LOQ). The application of the assay was demonstrated in a pharmacokinetic study on four healthy beagle dogs. The dogs were treated with methadone either with subcutaneous injections or with intramuscular injections every forth hour during three days. The elimination was studied 36 hours after the last given dose. 3 INTRODUCTION The tertiary amine methadone (d,l-dimethylamino-4,4-diphenyl-3-heptanone, Fig.1a) is a synthetic analgesic opiate closely related with morphine. Since the introduction into human clinical practice in 1946, methadone has been widely used for cancer pain relief, in postoperative pain therapy and as a substitute for patients dependent upon heroin1,2. In Swedish veterinary medicine there are no approved drugs containing opiates. Therefore, the use of human drugs like methadone are, since many years, well established for postoperative pain relief in dogs, even though there is very little knowledge about metabolism, kinetics and bio-availability in the animal3. Doses and regimens have to be based upon human data and it is uncertain if the treatment is carried out in the optimal way. The pharmacokinetic parameters of methadone differ from that of other opiates. In all investigated species, methadone is described as a drug with a rapid distribution phase and a slow rate of elimination 4. Most of the pharmacokinetic studies conducted in humans have indicated highly variable interindividual half-lives1,5. Thus, a potential risk for toxic accumulation exists with repeated administration. This variability may require dose adjustment on the basis of individual pharmacokinetic parameters5. For humans, a dosage regimen recommended for pain relief is a dose every 4-6 hours the first 24 hours and then one dose every 12 hours to avoid accumulation and unwanted side-effects6. Recommended doses and regimens for dogs with a dose every 3-4 hours7 do not take that into consideration, although the risk for accumulation might be as great as for humans. Both in rats8, goats4 and dogs3,9, studies have shown an wide interindividual range in the terminal half-lives. CH3 O H3C N CH3 CH3 O CH3 D3C N CH3 CH3 Fig.1b The structure of 2H3-methadone. Fig.1a The structure of methadone. In order to quantify methadone in biological fluids, many analytical methods have been developed, including gas chromatography with nitrogen-phosphorus detection1, gas chromatography–mass spectometry10,11,12, high-performance liquid chromatography with UV-detection2,3,13,14 and radioimmunoassay4,5,8. Previously reported analytical procedures for measuring methadone in biological matrices have primarily involved multi-step extraction procedures, which gives a tedious and time consuming sample pre-treatment. Another problem with some of the published methods is lack of sensitivity. However, HPLC with UV detection has shown a limit of quantification (LOQ) of 2.5 ng/ml2,14, and gas chromatography with nitrogenphosphorus detector has shown even better sensitivity, with a LOQ of 0.5 ng/ml1. Mass spectrometric assays have been shown to provide increased sensitivity and selectivity over a wide range of chemical classes, and have been successfully applied to the analysis of several opiates15. Therefore, the use of mass spectrometric detection should increase the sensitivity even more. Despite that, studies using gas chromatography with single mass spectrometric detection (MS) has not shown increased sensitivity, when analysing methadone, compared to other methods (LOQ 5-40ng/ml)10,11,12. The use of tandem mass spectrometry (MS/MS) should, 4 theoretically, increase the sensitivity and selectivity, but no such study has been published. Mass spectrometric analytical methodologies offer several advantages over alternative means of quantitative analysis. For example MS enables the use of deuterated internal standards, which closely compensate for variations in the analytical procedure15. Methadone is a frequently used post-operative analgesic drug for dogs and it is important to be able to determine concentrations of methadone in dog plasma and thereby be able to decide effective doses and regimens to prevent side-effects. The aim of this study was to develop and validate a new bio-analytical method for quantification of methadone in dog plasma and apply it on a pharmacokinetic study. The intention was to develop a GC-MS/MS method, working in the SRM mode, in order to obtain increased sensitivity and more selective detection compared to other methods. Furthermore, simplification of the extraction procedure was also a main objective. 5 MATERIALS AND METHODS Chemicals Methadone (d,l – dimethylamino-4,4-diphenyl-3-heptanone, Fig.1a) hydrochloride and the analogue labelled with three deuterium atoms (2H3 methadone hydrochloride, used as internal standard, Fig.1b) was donated from Ulleråker hospital, Uppsala, Sweden. Other chemicals used, hexane, 2-buthanol, NaOH and toluene were of analytical grade and used without further purification. The water used was purified in a Milli-Q water purification system from Millipore (Bedford, MA, USA). Instrumentation A Hewlett-Packard 5890 Series II Gas Chromatograph (Waldbronn, Germany) equipped with a CTC analytics automatic sampler (Zwingen, Switzerland) and a ThermoFinnigan Mat TSQ 7000 Mass Selective Detector (triple quadrupole MS/MS; San Jose, CA, USA) was used for the analysis. A HP-5MS capillary column (30m x 0.32 mm ID) with film thickness of 0.25 m (5% phenylmethylsilyl) was used (Hewlett-Packard, Waldbronn, Germany). For instrument control, a computer with the software Xcalibur (ThermoFinnigan, San Jose, CA, USA) was used. The shaking apparatus used was an Edmund Bűhler 7400 Tűbingen SM 25 and the centrifuge used was a Heraeus Sepatech Megafug 1,0R. Plasma samples Four adult healthy beagle dogs (Astra Zeneca R&D animal department, Lund, Sweden) were given doses of methadone hydrochloride (Metadon ® Pharmacia, 10mg/ml) every fourth hour during two (dog 2 and 4) or three (dog 1 and 3) days. Blood samples were collected, right before the given doses, i.e. four hours after every injection, by a permanent catheter in V.jugularis. Blood samples were also collected 10min, 20min, 30min, 45min, 1h, 2h, 4h, 6h, 8h, 12h, 16h, 24h and 36h (48h for dog 2 and 4) after the last given dose. The four dogs were treated either with 0.1 mg/kg or 0.4 mg/kg and either with intramuscular (I.M.) injections or subcutaneous (S.C.) injections. Dog 1: methadone 0.1 mg/kg S.C. injection Dog 2: methadone 0.4 mg/kg S.C. injection Dog 3: methadone 0.1 mg/kg I.M. injection Dog 4: methadone 0.4 mg/kg I.M. injection Blood samples were centrifuged for 10 minutes and plasma were stored at -20C until analysis. The Ethical Committee for Animal Experiments, Lund, Sweden, approved the study protocol. Sample pre-treatment (extraction procedure) A single step liquid-liquid extraction procedure was used. 100 l of the internal standard solution (56ng/ml plasma or 14ng/ml plasma), 500 l Milli-Q water, 5.0 ml hexane:2-buthanol (97:3) and 100 l 1M NaOH was added to 500 l plasma. The sample was shaken for 15 min and then centrifuged for 10 min at 3500 rpm. The organic phase was transferred to clean tubes and evaporated to dryness at 50C under a gentle stream of dry nitrogen. The dry residue was redissolved in 50 l toluene and transferred to vials before GC-MS/MS analysis. 6 Gas chromatographic and mass spectrometric procedure Helium was used as the carrier gas at a flow-rate of 1.5 ml/min. Injections of 1.0 l were performed with the injector working in the split-less mode at 250C. The oven temperature program used was: 150C the first minute and then the temperature was gradually increased with 20C per minute for 6.5 minutes to 280C and then 280C for 1 minute. The MS interface was working at 300C. The mass spectrometer operated in the positive chemical ionization mode (NH3 (2.8x10⁻⁵Torr), 150eV) and [M+H]+ parent ions of methadone and the internal standard were monitored in the first quadropole (methadone m/z 310 and internal standard m/z 313). Argon (22.3mTorr) was used as collision gas to create daughter ions. Selected Reaction Monitoring (SRM) was used and the common daughter ion m/z 105 was chosen for both methadone and IS. Standard solutions and calibration Three different stock solutions from three independently weighed methadone hydrochloride portions and one of the internal standard were prepared by dissolving the adequate amount of drug in methanol. Appropriate solutions were then made in distilled water to prepare series of standard solutions containing approximately 0.0051.4ng methadone/ul (1.0-280ng/ml plasma). The standard solutions for the calibration curve were prepared from two different stock solutions. Two standard curves were obtained by adding constant amount of internal standard (14ng/ml in the interval 126ng methadone/ml and 56ng/ml in the interval 26-280ng methadone/ml) and varying amounts of methadone to drug-free plasma. Extraction was carried out as described above and the samples were analysed. Methadone/internal standard peak area ratios were calculated and standard curves were constructed by plotting the methadone/internal standard peak area ratios as a function of the known concentrations of methadone. A linear regression analysis was performed and the correlation coefficient was calculated. Quality control samples for pre-analysis validation and analytical verification (prepared from the third stock solution) with concentrations of 2.2, 9.0, 56 and 112ng/ml plasma were analysed together with standard curves. Analysis During the analysis of a set of clinical samples, control samples with the concentrations of 2.2, 9.0, 56 and 112ng/ml, calibration samples for two standard curves and plasma blank were extracted and analysed along with the unknowns. In order to avoid carry-over effects, rinsing with toluene was performed twice between every analysis. Validation Linearity: calibration samples were analysed, a linear regression method was used for curve fitting and the correlation coefficient was calculated. Limit of detection (LOD): calibration samples (0.1-26ng/ml plasma) were analysed to investigate the lowest concentration that could be detected. The LOD was defined as a peak with a height at least three times as high as the baseline noise level (S/N=3). The LOD was calculated by extrapolation because the lowest concentration investigated (0.1ng/ml) had S/N=20. 7 Limit of quantification (LOQ): acceptable limits for LOQ were 80-120% for accuracy and RSD ≤20% for precision16. Precision and accuracy: validation samples with the concentrations 2.2, 9.0, 56,112ng/ml plasma were analysed together with calibration samples and the precision and accuracy were calculated. Acceptable limits for the lowest concentration were 80-120% for accuracy and RSD ≤20% for precision. Acceptable limits for higher concentrations were 85-115% for accuracy and RSD ≤15% for precision16. During three days, samples with the concentration 112ng/ml (five samples a day) were analysed to get the between-day and within-day variability. To get the chromatographic precision, each sample was injected ten times. The samples were analysed together with calibration samples and accuracy and precision were calculated. Stability in plasma: a plasma pool with a methadone concentration of 112ng/ml plasma was prepared and stored in room temperature. During three days the samples from the pool (five samples a day) were extracted and analysed. The mean levels of methadone during these three days were then compared. Stability of extracts: a plasma pool with a methadone concentration of 112ng/ml plasma was prepared, extracted and stored in the vials in +4C. During five days the extracts (three extracts a day) were analysed and the mean levels of methadone during these five days were then compared. Selectivity: drug free samples from the dogs were analysed to make sure that there were no disturbing peaks at the retention time of methadone and internal standard. Plasma samples containing only internal standard were also investigated to control that no cross-talk between the SRM channels occurred. 8 RESULTS AND DISCUSSION Method Development Extraction procedure The use of a simple extraction procedure, i.e. a single step liquid-liquid extraction procedure, was possible because of the selective detection technique (MS/MS) that was used and was preferable to minimize the risk for analyte loss. The use of a deuterium-labelled internal standard, which has almost identical physio-chemical properties as methadone and therefore controls sample loss closely, was also possible when using mass spectrometric detection. Methadone has a tendency to adsorb to surfaces17. To prevent that, hexane was mixed with 2-buthanol as the organic phase. 2-buthanol competes with methadone for the surface sites. The alcohol also increases the degree of extraction by increasing hydrogen bonding to the analyte. Comparison between saturated carbonate buffer (pH 9.39) and 1M NaOH for setting of plasma-pH, was made by extracting identical samples with the two methods. No difference could be seen in recovery and NaOH was chosen because, theoretically, the higher pH the better when extracting a base. During the development of this assay it was observed that addition of 0.5 ml water to the plasma samples (n=5), prior to extraction, gave cleaner chromatograms with less background noise. We also compared to shake the samples (n=5) horizontally respective vertically in the extraction tubes and could see that the samples shaken horizontally gave ten times higher peaks in the chromatograms compared to the samples shaken vertically. The samples shaken vertically had probably not reached equilibrium after 15 minutes and with extended shaking time the differences would most likely not have been seen. Gas chromatographic and mass spectrometric procedure To start with, a comparison between single-stage gas chromatographic mass spectometry (GC-MS) operating in electron ionization (EI) mode and MS operating in chemical ionisation (CI) mode were made. When scanning m/z 40-400 in EI mode, the fragments m/z 294 for methadone and m/z 297 for the internal standard were chosen for SIM because those were largest. The same procedure was then made in CI mode and the protonated molecular ions m/z 310 for methadone and m/z 313 for the internal standard were chosen. CI was selected because it gave the greatest signal-to-noise (S/N) ratio when running identical samples: CI/EI (S/N)~100. Thereafter, a comparison between MS and MS/MS was made. The use of CI, that gave more intense parent ions compared to EI, was also preferable when using MS/MS because the parent ions then split again into daughter ions. Selected Reaction Monitoring (SRM) was used and the common daughter ion m/z 105 was chosen for methadone with the parent ion m/z 310, and for the internal standard with the parent ion m/z 313. Fig.2a shows the full scan daughter ion spectrum for methadone. The retention time was 5.11 minutes (Fig.2b) and the chromatographic procedure was completed within 8.5 minutes. No interfering peaks were observed. 9 Fig.2a The full scan daughter ion spectrum of methadone (parent ion m/z 310). Fig.2b. SRM chromatogram of methadone: parent ion m/z 310, daughter ion m/z 105. MS/MS has advantage over MS due to superior sensitivity and selectivity, which also was shown in the test. The limit of detection (LOD, signal/noise, S/N=3) when running CI-MS was approximately 10ng/ml to compare with LOD <0.1ng/ml (S/N=20, see further section Validation below) when running MS/MS. MS/MS was therefore selected for quantitative purposes. Fig.3 shows representative chromatogram from plasma with a spiked concentration of 0.1ng/ml, which was the lowest concentration that was investigated. RT: 0.00 - 8.51 100 NL: 1.16E4 RT: 5.14 AA: 23114 TIC F: + c CI SRM ms2 310.00@25.00 [ 104.50-105.50] MS ICIS 1117met04_031120 095317 90 Relative Abundance 80 70 60 50 40 30 20 RT: 6.57 AA: 1066 10 0 NL: 9.97E4 RT: 5.12 AA: 186296 TIC F:parent + c CI SRM ion m/z 310 and daughter Fig.3 Plasma sample with the spiked concentration 0.1ng/ml. SRM: 100 ms2 313.00@25.00 ion90 m/z 105. [ 104.50-105.50] MS ICIS 1117met04_031120 095317 80 70 60 50 40 30 10 Validation A linear regression method was used to obtain the best fit of the peak-area ratios of methadone and the internal standard as a function of methadone concentration. The calibration curve covered two wide ranges, from approximately 1.0 to 26ng/ml (IS14ng/ml) and from 26 to 280ng/ml (IS 56ng/ml) with good linearity (Fig.4). The correlation coefficients (R2) obtained were 0.97-0.99, indicating that a good proportionality existed between the response and concentration of methadone. The limit of detection (LOD, S/N= 3) of the assay was calculated to be 15pg/ml by extrapolation from the results obtained at the lowest concentration investigated (0.1ng/ml). ratio metadon/metadon-d3 8,0000 7,0000 6,0000 2 R = 0,9989 5,0000 4,0000 3,0000 2,0000 1,0000 0,0000 0 5 10 15 20 25 30 35 40 45 50 ng/0.5ml Fig.4 Calibration curve in the interval 0.5-13ng/0.5ml (1.0-26ng/ml). Table 1 shows that the limit of quantification (LOQ), i.e. the lowest concentration that could be determined with precision of RSD ≤20% and accuracy of 80-120% was 2.2ng/ml plasma (S/N= 60). For higher concentrations, acceptable limits for precision was RSD ≤15% and for accuracy 85-115%16. The results were within acceptable limits when the validation samples, with the concentrations 2.2, 9.0, 56 and 112ng/ml, were run together with calibration samples. The precision became worse at lower concentrations of the validation samples, but the accuracy seemed to be independent of the concentration. Conc. (ng/ml) Mean(10samples) SD Precision(RSD%) Accuracy (%) 2.2 2.3 0.2 18.3 105 9.0 9.7 0.6 12.7 108 56 60 1.4 4.7 108 112 119 2.3 3.9 107 Table 1. Accuracy and precision of validation samples with the concentrations 2.2, 9.0, 56 and 112ng/ml plasma. The between-day and within-day accuracy and precision, where plasma samples (c=112ng/ml) were analysed three different days, are shown in Table 2. The withinday results are based on the means for five samples a day and the between-day results are shown as Total in the table below. Acceptable limits for accuracy is 85115% and for precision RSD ≤15%. The accuracy was not within acceptable limits day two. That may be due to unstable GC-MS/MS conditions (see Table 3, day 2). 11 Day1(mean) Precision(RSD%) 3.9 Accuracy (%) 110 Day2(mean) 12 117 Day3(mean) 6.6 106 Total 7.5 111 Table 2. Five samples a day were run for three days. Mean day 1-3 gives the within-day accuracy and precision and Total gives the between-day accuracy and precision. The chromatographic precision, when the samples above were injected ten times each, showed great variability. The results were notably worse for three samples day two. The reason for this variability may come from the fact that the collision-gas pressure was not stable during the runs. The results for each sample are shown in Table 3. Day1 Sample1 Precision(RSD%) 2.7 Accuracy(%) 113 Sample2 4.7 111 Sample3 5.7 107 Sample4 1.6 112 Sample5 2.4 108 Day2 Sample6 Precision(RSD%) 3.8 Accuracy(%) 128 Sample7 7.0 114 Sample8 5.6 109 Sample9 18 121 Sample10 16 111 Day3 Sample12 3.5 97 Sample13 2.9 111 Sample14 3.9 109 Sample15 4.3 112 Sample11 Precision(RSD%) 0.6 Accuracy(%) 101 Table 3. The chromatographic precision when the samples were injected ten times each. Table 4 shows the results for stability in plasma where the plasma samples (c=112ng/ml) stored in room temperature were extracted and analysed together with fresh calibrants for three different days (five samples a day). There seemed to be no major degradation of methadone during the three days studied. The alterations shown are probably due to the extraction procedure and/or small differences in the GC-MS/MS between the three days studied. Day1(mean of 5 samples) 100% Day2(mean of 5 samples) 105% Day3(mean of 5 samples) 93% Table 4. Plasma samples stored in room temperature showed no major degradation of methadone during the three days studied. Stability of the extracts was examined by analysing plasma samples (c=112ng/ml) that were extracted on the same day and then stored in the vials in +4°C. For five days, three extracts a day were analysed. There seemed to be no major degradation of methadone during the three days studied. The alterations shown are probably due to the extraction procedure and/or small differences in the GC-MS/MS between the five days studied (Table 5). 12 Day1(mean) Day2(mean) Day3(mean) Day4(mean) Day5(mean) 100% 98% 104% 104% 110% Table 5. The mean of three samples a day is compared with each other. No major degradation of methadone could be seen during the five days studied. The selectivity test, when methadone-free samples from the dogs were analysed, showed peaks corresponding to 0.4ng/ml, negligible compared to LOQ. When blank plasma samples containing only internal standard were run, a peak corresponding to 0.2ng/ml in the methadone chromatogram could sometimes be seen. Whether that was due to crosstalk between the methadone-internal standard SRM-channels or a carry-over effect was unclear. The quantification limit achieved by this method was comparable to other methods used to analyse methadone in plasma2,12. A comparison between LOQ and LOD according to signal-to-noise ratios gives that it could be possible to improve the quantification limit because LOQ, 2.2 ng/ml (S/N=60), was much higher than LOD, 15pg/ml (S/N= 3). That may be possible by decreasing the variability in the GCMS/MS procedure by keeping the gas pressure more stable during the runs. A smaller amount of toluene for redissolution of methadone or an increase in injection volume might also improve the quantification limit. Bioanalysis of dog plasma The application of the developed assay was demonstrated after administration of methadone (0.1 or 0.4mg/kg, S.C. or I.M.) every fourth hour during two or three days to four healthy beagle dogs. The doses given were recommended doses for pain relief in dogs and used in clinical practice7. Plasma samples were collected four hours after every injection, i.e. right before the next dose. The concentrations were found to vary over a wide range (Fig.5a,b). For the two dogs that were given 0.1mg/kg, the concentrations varied between 2 to 45ng/ml and for the two dogs given 0.4mg/kg the concentrations varied between 5 to 190ng/ml four hours after the injections. For the dogs given the higher dose (dog 2 and 4) the study had to be interrupted after injection eight. The dogs then showed severe side-effects like vomiting and diarrhoea, hyper ventilation and apathy. The symptoms gradually vanished and eight hours after the last injection the dogs were completely recovered. The two dogs given the lower dose did not show any side-effects during the study. 13 50 40 30 S.C. 20 I.M. 10 pl e1 5 sa m pl e1 3 sa m pl e1 1 sa m pl e9 sa m pl e7 sa m pl e5 sa m sa m sa m pl e3 0 pl e1 ng methadone/ml 0.1mg/kg 4h after injection Fig.5a methadone concentrations four hours after every injection for the dogs treated with 0.1 mg/kg, either S.C.(dog 1) or I.M.(dog 3). 0.4mg/kg ng methadone/ml 200 150 S.C. I.M. 100 50 pl e8 sa m pl e7 sa m pl e6 sa m pl e5 sa m pl e4 sa m pl e3 sa m pl e2 sa m sa m pl e1 0 4h after injection Fig.5b methadone concentrations four hours after every injection for the dogs treated with 0.4 mg/kg, either S.C.(dog 2) or I.M. (dog 4). The elimination was studied by collecting plasma samples up to 36 hours (48 hours for dog 2 and 4) after the last dose (Fig.6 a,b). Initially, the two dogs treated with methadone S.C. showed higher concentrations compared to the two dogs given methadone I.M., but at the end of the study the concentrations had decreased substantially for all four dogs, for two dogs (3 and 4) even below LOQ. 14 0.1mg/kg ng methadone/ml 100 80 60 S.C. 40 I.M. 20 36h 24h 16h 12h 8h 6h 4h 2h 1h 45min 30min 20min 10min 0 Elimination Fig.6a methadone concentrations after the last given dose for the dogs treated with 0.1mg/kg, either S.C.(dog 1) or I.M.(dog 3). 0.4mg/kg ng methadone/ml 350 300 250 S.C. 200 150 I.M. 100 50 48h 36h 24h 16h 12h 8h 6h 4h 2h 1h 45min 30min 20min 10min 0 Elimination Fig.6b methadone concentrations after the last given dose for the dogs treated with 0.4mg/kg, either S.C.(dog 2) or I.M. (dog 4). It was unclear if steady state was achieved during the days studied and it had therefore been interesting to continue the study further days to be able to evaluate if any accumulation appeared. Because of the limited sample size it was not adequate to draw any quantitative pharmacokinetic conclusions from the results. Hopefully, a greater study with several dogs will be performed in the future. CONCLUSION The GC-MS/MS assay described in this report had a simple sample preparation and a sensitivity and selectivity that was sufficient for the purpose to quantify methadone in dog plasma at the concentrations encountered in clinical practice. 15 REFERENCES 1. Schmidt N, Sittl R, Brune K, Geisslinger G. Rapid Determination of Methadone in Plasma, Cerebrospinal fluid, and Urine by Gas Chromatography and its Application to Routine Drug Monitoring, Pharmaceutical Research, Vol.10, No.3, 1993 2. Boulton D.W, Lindsay Devane C, Development and Application of a Chiral High Performance Liquid Chromatography Assay for Pharmacokinetic Studies of Methadone, Chirality 12:681-687, 2000 3. Garret E.R, Derendorf h, Mattha A.G, Pharmacokinetics of Morpine and its Surrogates VII: HighPerformance Liquid Chromatographic Analyses and Pharmacokinetics of Methadone and its Derived Metabolites in Dogs, Journal of Pharmaceutical Sciences, Vol.74, No.11, November 1985 4. Kock M, Thompson E, Vulliet P.R, Brooks D.L, Pharmacokinetic Properties of Methadone Hydrochloride after Single Intramuscular Administration in Adult Dairy Goats, Laboratory Animal Science, Vol.44, No.5, October 1994 5. Inturrisi C.E, Colburn W.A, Kaiko R.F, Houde R.W, Foley K.M. Pharmacokinetics and pharmacodynamics of methadone in patients with chronic pain, Clinical Pharmacological Therapy, Vol.41, No.4, April 1987 6. Fass® 2002, LINFO läkemedelsinformation AB, Elanders, Kungsbacka 2002 7. Hellebrekers L.J, Clinical Pharmacology of analgesic agents, Animal pain; a practice-oriented approach to an effective pain control in animals pp 96, ed. L.J. Hellebrekers, Van Deer Wees uitgeverij, Utrecht, 2000 8. Ling G.S.F, Umans J.G, Inturrisi C.E, Methadone: Radioimmunoassay and Pharmacokinetics in the rat, Journal of Pharmacology and Experimental Therapeutics, Vol.217, No.1, January 1981 9. Dobromylsky, P, The pharmacokinetics of methadone during the perioperative period in dogs, Journal of Veterinary Anaesthesiology, Vol.20, June 1993 10. Bermejo A.M, Fernandez P, Cruz A, Lopez-Rivadulla M, Sanchez I, Methadone Determination by GCMS in plasma, Proc. Int. Meet. Int. Assoc. Forensic Toxicol., 31st, 1994 11. Kang G.I, Abbott F.S, Analysis of Methadone and metabolites in biological fluids with gas chromatography – mass spectrometry, Journal of Chromatography, biomedical applications, 231, 311319, 1982 12. Sullivan H.R, Marshall F.J, McMahon R.E, Anggard E, Gunne L-M, Holmstrand J.H, Biomed. Mass Spectrom, No.2, 197, 1975 13. Wolff K, Sanderson M, Hay A.W.M, Raistrick D, Methadone Concentrations in Plasma and Their Relationship to Drug Dosage, Clinical Chemistry, Vol.37, No.2, 1991 14. Schmidt N, Brune K, Geisslinger G, Stereoselective determination of the enantiomers of methadone in plasma using high-performance liquid chromatography, Journal of Chromatography, 583, 195-200, 1992 15. Thomas B.F, Jeffcoat A.R, Myers M.W, Mathews J.M, Cook C.E, Determination of l--acetylmethadol, l-noracetylmethadol and l--dinoracetylmethadol in plasma by gas chromatography – mass spectrometry, Journal of Chromatography B: Biomedical applications, 655, 201-211, 1994 16. Shan V.P, Midha K.K, Findlay J.W.A, Hill H.M, Hulse J.D, McGilveray I.J, McKay G, Miller K.J, Patnaik R.N, Powell M.L, Tonelli A, Viswanathan C.T, Yacobi A, Bioanalytical Method Validation-A Revisit with a Decade of progress, Pharmaceutical Research, Vol.17, No.12, 2000 17. Personal Communication: Elisabeth Fredriksson, Departement of Chemistry, National Veterinary Institute (SVA), Uppsala, Sweden, 2003 16
