StanBevers TX Costs of Running a Breeding Cow
advertisement
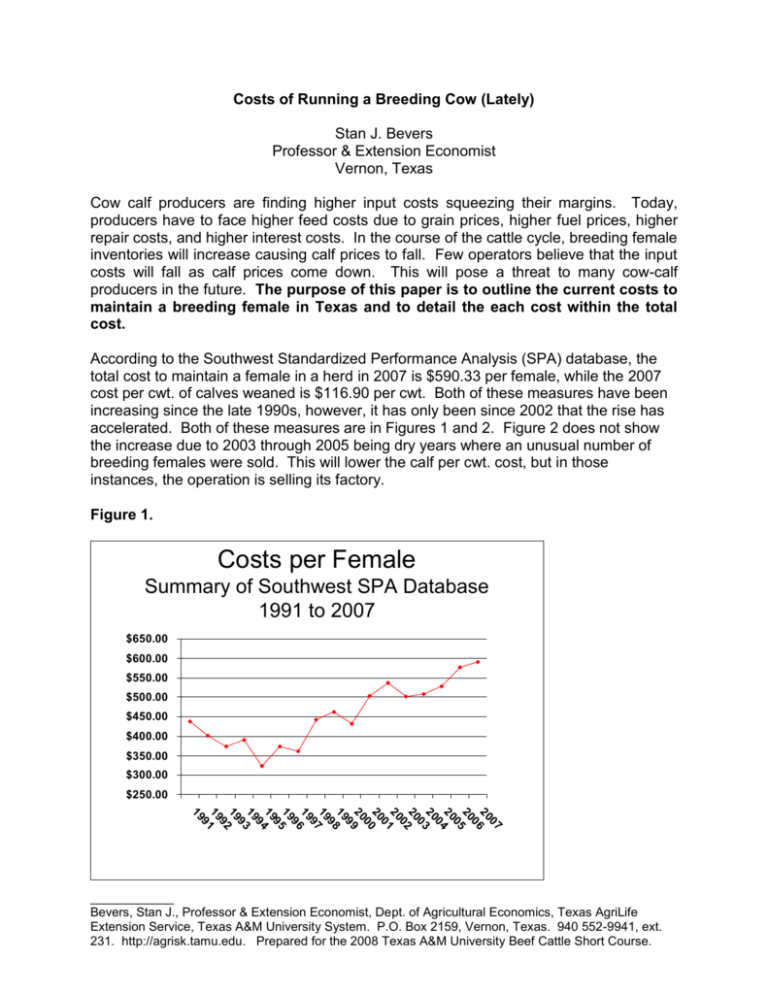
Costs of Running a Breeding Cow (Lately) Stan J. Bevers Professor & Extension Economist Vernon, Texas Cow calf producers are finding higher input costs squeezing their margins. Today, producers have to face higher feed costs due to grain prices, higher fuel prices, higher repair costs, and higher interest costs. In the course of the cattle cycle, breeding female inventories will increase causing calf prices to fall. Few operators believe that the input costs will fall as calf prices come down. This will pose a threat to many cow-calf producers in the future. The purpose of this paper is to outline the current costs to maintain a breeding female in Texas and to detail the each cost within the total cost. According to the Southwest Standardized Performance Analysis (SPA) database, the total cost to maintain a female in a herd in 2007 is $590.33 per female, while the 2007 cost per cwt. of calves weaned is $116.90 per cwt. Both of these measures have been increasing since the late 1990s, however, it has only been since 2002 that the rise has accelerated. Both of these measures are in Figures 1 and 2. Figure 2 does not show the increase due to 2003 through 2005 being dry years where an unusual number of breeding females were sold. This will lower the calf per cwt. cost, but in those instances, the operation is selling its factory. Figure 1. Costs per Female Summary of Southwest SPA Database 1991 to 2007 $650.00 $600.00 $550.00 $500.00 $450.00 $400.00 $350.00 $300.00 $250.00 07 20 6 0 20 5 0 20 4 0 20 3 0 20 2 0 20 1 0 20 0 0 20 9 9 19 8 9 19 7 9 19 6 9 19 5 9 19 4 9 19 3 9 19 2 9 19 1 9 19 ____________ Bevers, Stan J., Professor & Extension Economist, Dept. of Agricultural Economics, Texas AgriLife Extension Service, Texas A&M University System. P.O. Box 2159, Vernon, Texas. 940 552-9941, ext. 231. http://agrisk.tamu.edu. Prepared for the 2008 Texas A&M University Beef Cattle Short Course. Figure 2. Calf Costs per Cwt. Summary of Southwest SPA Database 1991 to 2007 $140.00 $130.00 $120.00 $110.00 $100.00 $90.00 $80.00 $70.00 $60.00 07 20 6 0 20 5 0 20 4 0 20 3 0 20 2 0 20 1 0 20 0 0 20 9 9 19 8 9 19 7 9 19 6 9 19 5 9 19 4 9 19 3 9 19 2 9 19 1 9 19 Figure 3 combines the calf costs per cwt. with the price received for the calves. As shown, when the calf cost line is above the calf price the average net income is negative. Conversely, whenever the calf price line is above the calf cost line, the average net income is positive. It should be pointed out that all costs are included in the SPA analysis including family labor and depreciation. This differs from other cost estimates that typically do not include these costs. A cow-calf operator should include his labor and will eventually have to replace his equipment or improvements. If a ranch is not accounting for these costs, it will be profiting at the expense of its resources. Since 1991, there have only been five years where the herds within the Southwest SPA database recorded a positive net income. Does this mean that the herds were liquidated for want of a profit? No, this simply means that that particular year adequate revenue was not generated from the cows to cover all of the costs, including family and depreciation, to maintain the females. In those years, the herds were not replacing depreciable assets or they cut back on their distributions going out of the herd. 2 Figure 3. Calf Costs versus Calf Price Summary of Southwest SPA Database 1991 to 2007 $140.00 $130.00 $120.00 Calf Cost $110.00 $100.00 Calf Price $90.00 $80.00 $70.00 $60.00 07 20 6 0 20 5 0 20 4 0 20 3 0 20 2 0 20 1 0 20 0 0 20 9 9 19 8 9 19 7 9 19 6 9 19 5 9 19 4 9 19 3 9 19 2 9 19 1 9 19 Input Costs (Lately) In each of the figures, an acceleration of inputs can be noted since 2003. For the purposes of this paper, a sub-set of seventy-one Texas herds that have completed the SPA analysis since 2003 were isolated in order to determine just what the specific costs were. The location of these 71 herds were primarily in Texas SPA Regions 1, 2, and 5 (See Figure 4). In order to equalize the numbers, herds in Region 1 and 2 were combined. As such, in Region 1 and 2, there were 37 herds. Thirty-four herds were in Region 5. Table 1 presents the results of the analysis on a breeding female basis. The number of breeding females (open or bred) that are on hand as of January 1 of the year that the calves are weaned is used. It should be pointed out that these figures are averages and any ranch will be different. However, these figures can be used as benchmarks to identify where a particular ranch may need to focus its efforts for reducing its own costs. Table 1 is, in effect, an income statement with income and expense accounts listed down the left-hand side. The data is summarized by the 71 herd average, Region 1& 2 average, and Region 5 average. There are two columns for each summary, the actual income or expense value and then the percentage that that particular account makes up of the total. A description of most accounts follow. 3 Figure 4. 5 2 4 1 3 Table 1. 2003 - 2007 Average Costs to Maintain a Breeding Female in Texas 71 herd Average Mean Percent Operating Revenues 1) Raised Livestock 2) Non-cash Values 3) Gains/Losses 4) Other Income Gross Revenues Region 1 & 2 Mean Percent Region 5 Mean Percent 405.27 101.07 19.33 13.22 538.90 75.2 18.8 3.6 2.5 100.0 420.20 83.26 3.94 12.75 520.15 80.8 16.0 0.8 2.5 100.0 389.02 120.46 36.08 13.74 559.29 69.6 21.5 6.5 2.5 100.0 Operating Expenses 1) Feed Purchase 2) Hired Labor & Management 3) Depreciation 4) Fertilizers 5) Repairs & Maintenance 6) Rents & Leases 7) Gasoline, Fuel, Oil 8) Family Living Withdrawals 9) Veterinary & Breeding 10) Interest 11) Supplies 12) Property Taxes 13) Custom Hire Work 14) Insurance 15) Utilities 16) Miscellaneous 17) Chemicals 18) Professional Fees 19) Seed & Plants 20) Freight & Trucking 21) Net Accural Expenses 80.38 77.10 74.81 47.72 35.91 34.32 26.56 24.27 24.19 22.83 18.91 18.31 17.54 12.16 12.38 10.12 6.93 5.30 3.51 1.40 (0.89) 14.5 13.9 13.5 8.6 6.5 6.2 4.8 4.4 4.4 4.1 3.4 3.3 3.2 2.2 2.2 1.8 1.3 1.0 0.6 0.3 -0.2 81.94 104.89 66.52 63.63 34.65 29.90 31.27 25.60 21.17 10.02 20.48 22.47 19.04 11.15 10.46 8.63 5.49 6.41 4.42 0.35 (4.29) 14.3 18.3 11.6 11.1 6.0 5.2 5.4 4.5 3.7 1.7 3.6 3.9 3.3 1.9 1.8 1.5 1.0 1.1 0.8 0.1 (0.7) 78.69 46.85 83.84 30.40 37.28 39.12 21.43 22.82 27.47 36.77 17.20 13.78 15.91 13.26 14.48 11.74 8.49 4.09 2.51 2.54 2.81 14.8 8.8 15.8 5.7 7.0 7.4 4.0 4.3 5.2 6.9 3.2 2.6 3.0 2.5 2.7 2.2 1.6 0.8 0.5 0.5 0.5 Total Costs (Including Family) 553.74 100.0 574.20 100.0 531.47 100.0 Net Income (14.84) (54.05) 4 27.82 Operating Revenues While the focus of this analysis is the cost structure, it would be remiss to not mention the revenue component. The Raised Livestock account represents the value per female of the calves that are sold or transferred from the cow-calf enterprise. During the five year period, the overall average was $405.27 per breeding female. This is considerably less than what most ranchers would expect. This is because not all females in the herd raise a calf. The value represents 75.2 percent of the total revenue generated by the cow-calf resources. Non-cash values represent the value of retained breeding stock. In effect, this is the value per breeding female of primarily replacement heifers or replacement bulls. This should not be confused with what the replacement stock is worth. The Gains/Losses value represents the net revenue received from the sale of breeding stock. Finally, Other Income typically represents secondary income (per breeding female) received from cow-calf revenue. Common Other Income includes government disaster payments for cattle or the minimum sale of hay. The average total gross revenues are $538.90 per breeding female. Operating Expenses As mentioned earlier, there are 71 herds that have completed the SPA analysis since 2003 that make up this overall average. The average total cost per breeding female for this dataset is $553.74. Using this cost along with the average gross revenue of $538.90 per breeding female results in a net loss of $14.84 per breeding female. These costs are lower for the Region 1 & 2 herds ($574.20 per breeding female) and higher for the herds in Region 5 ($531.47 per breeding female). The largest cost for the 71 Texas herds was Purchased Feed. It averaged $80.38 per breeding female (14.5%) and would include protein supplements, forages, and salt and minerals purchased. This cost is certainly being influenced by the higher costs of corn and feed products. Purchased feed expenses varied very little two regions. The second largest expense of the database is Hired Labor and Management and amounted to $77.10 per breeding female (13.9%). This expense would include the salary, employer taxes, and benefits paid to those hired to operate or assist with the ranch tasks. Contract labor (day labor) would be included as well. Unless the owner receives a salary from the ranch operation, his labor would not be included here. This expense would be included in the family living withdrawals. Combining these two expense accounts would account for all labor and management on the operation. Family Living Withdrawals amounted to $24.27 per breeding female. Combined, the amount for labor and management was $101.37 per breeding female and equaled 18.3 percent of the total costs. The third largest expense is depreciation at $74.81 per breeding female. It made up 13.5 percent of the total. Depreciation is not always included in cost analyses, but it always should be. If a ranch is operating within any year, then it is aging (wearing out) 5 its assets. These assets include breeding stock (females and bulls), machinery and equipment, and buildings and improvements. Unless the assets are appreciating in value (rarely happens except in the case of the land assets), it is depreciating and the ranch is losing value. However, the problem with calculating depreciation is that the IRS allows many methods of depreciation. Furthermore, the depreciation allowance, on the federal level, is used as a monetary policy tool. An example of this is the Section 179 that allows ranches, in specific cases, to expense an asset purchase entirely in one year. The point is that depreciation can be terribly distorted in any one year. Couple this with the different resource bases of ranches, then depreciation can be one of the most variable expense of ranches. For the purposes of analyzing the majority of these herds, depreciation was calculated using the straight-line basis of depreciation. Thus, the three largest expenses for these cow-calf operations were feed purchased, all labor, and depreciation. Combined, these expenses totaled $256.56 per breeding female and accounted for 46.3 percent of the total expenses. The remaining top ten expenses for these ranches were Fertilizers - $47.72 (8.6%), Repairs and Maintenance - $35.91 (6.5%), Rents and leases - $34.32 (6.2%), Gasoline, fuel and oil - $26.56 (4.8%), Veterinary & breeding - $24.19 (4.4%), and Interest $22.83 (4.1%). Of these, fertilizer, fuel, and interest have been rising the fastest. Totaled, these expenses account for an additional 34.6% percent of the total expenses. While not insignificant nor unimportant, the remaining eleven expenses amount to $105.67 per breeding female or 19.1 percent of the total expenses. In the case of these expenses, very few ranches are “average” on all expenses. The important message is that first, a ranch knows what its true cost of running a breeding female is. Secondly, a ranch should identify those expenses that are not contributing to the overall productivity of the operation. If the ranch’s goal is to be profitable, then every expense should be scrutinized to determine whether it is making an adequate contribution to weaning more calves. 6
