A. B. Figure S3: Comparison of TA/EX and Observed X
advertisement
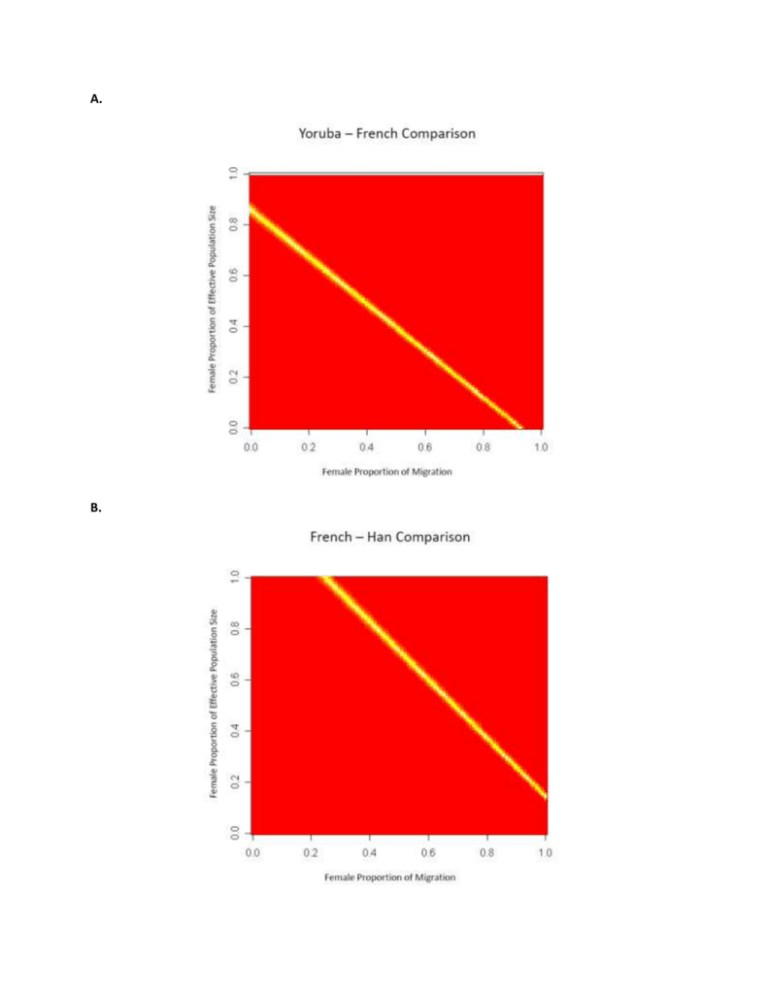
A. B. Figure S3: Comparison of TA/EX and Observed X-Linked Delta Values. A) The female proportion of the effective population size and the female proportion of migration were both varied over a range from 0.01 to 0.99. For each of the 9,800 possible pairs of these values, a list of TA/EX values was produced from the observed Yoruba-French autosomal delta values. This list of TA/EX values was compared to the list of observed X-linked delta values using a two-sided Wilcoxon Test. The color at a given point represents the resulting p-value of this comparison. Red locations on the grid represent Nf/N, mf/m value-pairs that produce sets of TA/EX delta values that significantly differ from the observed X-linked values; white and yellow regions on the grid represent value-pairs that produce TA/EX values that do not significantly differ from the observed X-linked values. B) The same as in A, except that the observed French-Han autosomal delta values were used as input for the transformation.

