phys-4420 thermodynamics & statistical mechanics spring 2006
advertisement
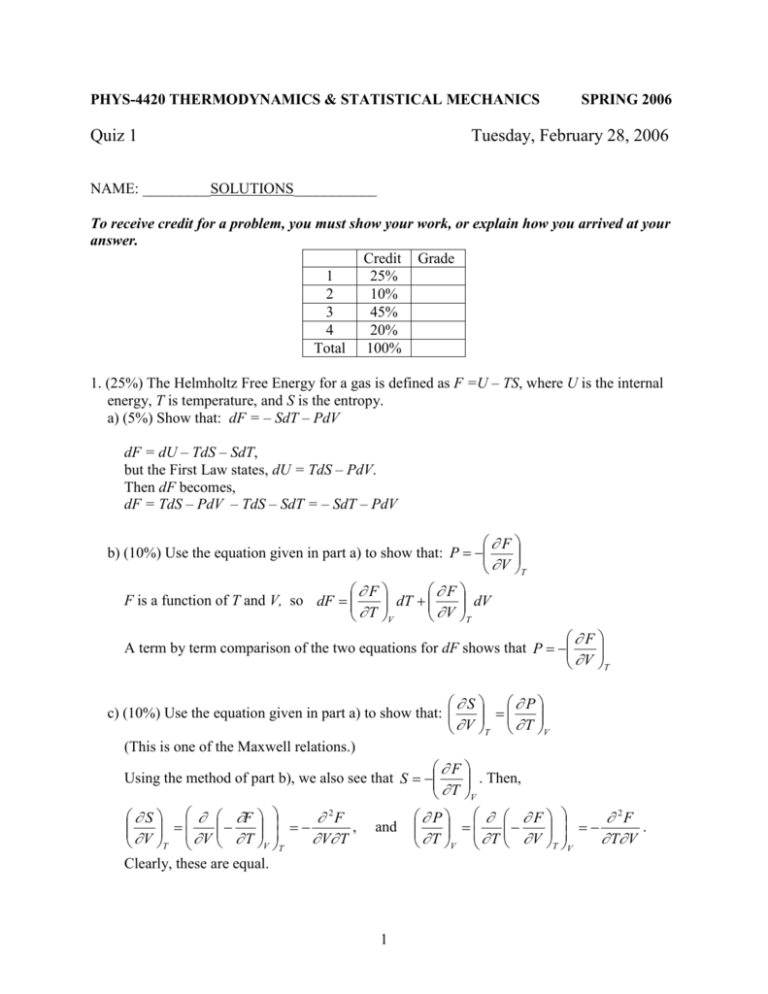
PHYS-4420 THERMODYNAMICS & STATISTICAL MECHANICS Quiz 1 SPRING 2006 Tuesday, February 28, 2006 NAME: _________SOLUTIONS___________ To receive credit for a problem, you must show your work, or explain how you arrived at your answer. Credit Grade 1 25% 2 10% 3 45% 4 20% Total 100% 1. (25%) The Helmholtz Free Energy for a gas is defined as F =U – TS, where U is the internal energy, T is temperature, and S is the entropy. a) (5%) Show that: dF = – SdT – PdV dF = dU – TdS – SdT, but the First Law states, dU = TdS – PdV. Then dF becomes, dF = TdS – PdV – TdS – SdT = – SdT – PdV F b) (10%) Use the equation given in part a) to show that: P V T F F dT dV F is a function of T and V, so dF T V V T F A term by term comparison of the two equations for dF shows that P V T S P c) (10%) Use the equation given in part a) to show that: V T T V (This is one of the Maxwell relations.) F . Then, Using the method of part b), we also see that S T V S F 2F , V T V T V T V T Clearly, these are equal. and 1 F P 2F . T V T V T V T V 2. (10%) Show that the third law of thermodynamics predicts that the ideal gas equation cannot hold at T = 0. (Hint: use the results of the first question.) S must go to The third law says that all entropy changes must go to zero at T = 0. Then V T S P P , so must go to zero at T = 0. zero at T = 0. However, V T T V T V For an ideal gas, P nRT , and V P nR . This does not go to zero at T = 0. T V V 3. (45%) The diagram is a graph of pressure vs. volume for one mole of a monatomic ideal gas that was taken from point A to point B, then to point C, and back to point A along the path shown. a) (5%) Find an expression for TA, the temperature of the gas at point A. Express your answer in terms of P0, V0, and constants. For one mole of an ideal gas, PV RT , so T PV PV , and TA 0 0 R R TA 2 P0V0 R b) (5%) Find an expression for TB, the temperature of the gas at point B. Express your answer in terms of P0, V0, and constants. T PV 2 P 2V , so TB 0 0 R R TB 4 P0V0 R c) (5%) How much work, W, was done by the gas as it went from A to B. Express your answer in terms of P0 and V0. Work equals the area beneath the P-V graph. It can be viewed as a trapezoid, or a triangle on top of a rectangle. Then, 1 P 2 P0 W V0 P0 P0V0 W 0 V0 , or 2 2 3 P0V0 2 d) (10%) How much heat, Q, went into the gas as it went from A to B. Express your answer in terms of P0 and V0. W 3 P0V0 , so only U is needed. 2 3 3 PV PV 3 9 U CV T R(TB TA ) R 4 0 0 0 0 (3P0V0 ) P0V0 2 2 R R 2 2 9 3 12 Then Q P0V0 P0V0 P0V0 2 2 2 Q = U + W From part c), W Q = 6P0V0 ¯¯¯¯¯¯¯¯ 3 e) (10%) Calculate the entropy change of the gas as it went from A to B. Express your answer as a multiple of the gas constant R. dQ dU PdV dT PdV 3 dT ( RT / V )dV 3 dT dV CV R R R T T T T 2 T T 2 T V VB dV T V 3 3 TB dT 3 S A B R R R ln B R ln B R ln 4 R ln 2 VA V 2 TA T 2 TA VA 2 dS S A B 3 R ln 22 R ln 2 3R ln 2 R ln 2 2 SB – SA = SAB = 4Rln 2 ¯¯¯¯¯¯¯¯¯¯¯¯¯¯¯¯¯¯¯¯ R P P Or, use a Tds equation, e.g : Tds cv dT T dv , where T v T v v f) (5%) Calculate the entropy change of the gas as it went from B to C. Express your answer as a multiple of the gas constant R. dQ dT 3 dT CV R , and T T 2 T T 3 TC dT 3 R R ln C , TC is needed. 2 TB T 2 TB Constant volume, so dS S B C Since V is constant, T P, so TC PC 1 3 1 , and S B C R ln TB PB 2 2 2 3 SC S B S B C R ln 2 2 g) (5%) Calculate the entropy change of the gas as it went from C to A. Express your answer as a multiple of the gas constant R. dQ dT 5 dT CP R , since CP – CV = R. T T 2 T T 5 TA dT 5 R R ln A 2 TC T 2 TB Constant pressure, so dS SC A Since P is constant, T V, so TA VA 1 5 1 , and SC A R ln TC VC 2 2 2 5 S A SC SC A R ln 2 2 4 4. (20%) Prove that, on a P-T graph showing the phases of water, the slope of the sublimation curve at the triple point is greater than that of the vaporization curve at the same point. Useful information: v >> v or v Heat of fusion: 12 = 3.34 ×10⁵ J/kg Heat of vaporization: 23 = 2.25 ×10⁶ J/kg 13 dP Sublimation: 13 dT 13 T (v v) Tv 23 dP Vaporization: 23 dT 23 T (v v) Tv 12 23 31 0 12 23 13 , so 13 12 23 . dP dP Therefore, dT 13 dT 23 5 13 23
