experience4 - Broad Institute
advertisement
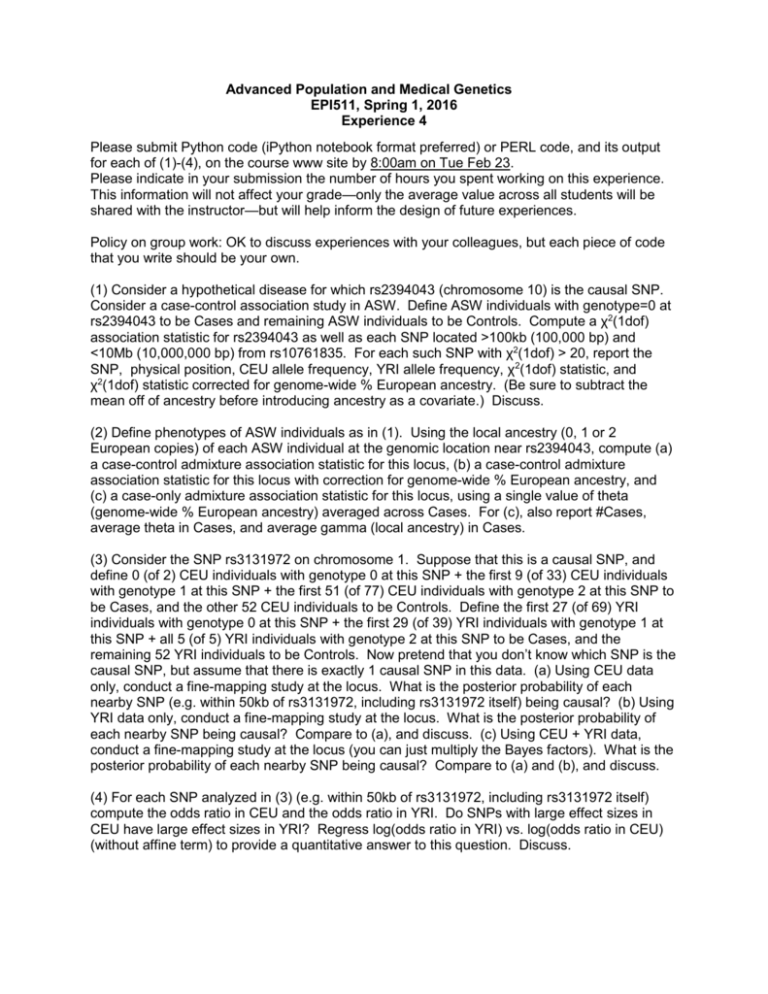
Advanced Population and Medical Genetics EPI511, Spring 1, 2016 Experience 4 Please submit Python code (iPython notebook format preferred) or PERL code, and its output for each of (1)-(4), on the course www site by 8:00am on Tue Feb 23. Please indicate in your submission the number of hours you spent working on this experience. This information will not affect your grade—only the average value across all students will be shared with the instructor—but will help inform the design of future experiences. Policy on group work: OK to discuss experiences with your colleagues, but each piece of code that you write should be your own. (1) Consider a hypothetical disease for which rs2394043 (chromosome 10) is the causal SNP. Consider a case-control association study in ASW. Define ASW individuals with genotype=0 at rs2394043 to be Cases and remaining ASW individuals to be Controls. Compute a χ2(1dof) association statistic for rs2394043 as well as each SNP located >100kb (100,000 bp) and <10Mb (10,000,000 bp) from rs10761835. For each such SNP with χ2(1dof) > 20, report the SNP, physical position, CEU allele frequency, YRI allele frequency, χ2(1dof) statistic, and χ2(1dof) statistic corrected for genome-wide % European ancestry. (Be sure to subtract the mean off of ancestry before introducing ancestry as a covariate.) Discuss. (2) Define phenotypes of ASW individuals as in (1). Using the local ancestry (0, 1 or 2 European copies) of each ASW individual at the genomic location near rs2394043, compute (a) a case-control admixture association statistic for this locus, (b) a case-control admixture association statistic for this locus with correction for genome-wide % European ancestry, and (c) a case-only admixture association statistic for this locus, using a single value of theta (genome-wide % European ancestry) averaged across Cases. For (c), also report #Cases, average theta in Cases, and average gamma (local ancestry) in Cases. (3) Consider the SNP rs3131972 on chromosome 1. Suppose that this is a causal SNP, and define 0 (of 2) CEU individuals with genotype 0 at this SNP + the first 9 (of 33) CEU individuals with genotype 1 at this SNP + the first 51 (of 77) CEU individuals with genotype 2 at this SNP to be Cases, and the other 52 CEU individuals to be Controls. Define the first 27 (of 69) YRI individuals with genotype 0 at this SNP + the first 29 (of 39) YRI individuals with genotype 1 at this SNP + all 5 (of 5) YRI individuals with genotype 2 at this SNP to be Cases, and the remaining 52 YRI individuals to be Controls. Now pretend that you don’t know which SNP is the causal SNP, but assume that there is exactly 1 causal SNP in this data. (a) Using CEU data only, conduct a fine-mapping study at the locus. What is the posterior probability of each nearby SNP (e.g. within 50kb of rs3131972, including rs3131972 itself) being causal? (b) Using YRI data only, conduct a fine-mapping study at the locus. What is the posterior probability of each nearby SNP being causal? Compare to (a), and discuss. (c) Using CEU + YRI data, conduct a fine-mapping study at the locus (you can just multiply the Bayes factors). What is the posterior probability of each nearby SNP being causal? Compare to (a) and (b), and discuss. (4) For each SNP analyzed in (3) (e.g. within 50kb of rs3131972, including rs3131972 itself) compute the odds ratio in CEU and the odds ratio in YRI. Do SNPs with large effect sizes in CEU have large effect sizes in YRI? Regress log(odds ratio in YRI) vs. log(odds ratio in CEU) (without affine term) to provide a quantitative answer to this question. Discuss. Possible topics for short Research Paper (an aggregate list of suggested topics will be provided on Feb 23. At that time, each student should choose one topic from the aggregate list.): • Use theory and simulations (HapMap3 genotypes, simulated phenotypes) to predict and assess the extent to which the top associated SNP at a locus in a GWAS in one continental population would replicate in a study in a different population (e.g. via slope of log odds ratio regression), under each of the following scenarios: (1) the causal SNP is a HapMap3 SNP, and all HapMap3 SNPs are typed, (2) the causal SNP is a HapMap3 SNP and is not typed or imputed, but all other HapMap3 SNPs are typed, (3) the causal SNP is a HapMap3 SNP, and this SNP along with a random subset of half of all HapMap3 SNPs is not typed or imputed, but all other HapMap3 SNPs are typed. Investigate the answer for different choices of GWAS population, replication population, causal variant allele frequency, and sample sizes. Note: it is appropriate to combine different populations with the same continental ancestry in order to increase the sample size for this problem. • Use theory and simulations (HapMap3 genotypes, simulated phenotypes) to develop and compare 3 methods for conducting fine-mapping in the ASW population: (1) a method that does not use local ancestry information, (2) a method that assesses evidence for causality separately for each local ancestry (0, 1 or 2 European copies) and then aggregates evidence for causality, (3) a method that assesses evidence for causality separately for each local ancestry, and also makes use of information about average local ancestry in disease cases, and then aggregates evidence for causality. Include simulations of (a) randomly chosen causal SNPs, (b) causal SNPs with unusually different LD patterns between Europeans and Africans, (c) causal SNPs with unusually large allele frequency differences between Europeans and Africans. • Or, feel free to design your own research topic.
