Integration Solutions: Profit, Equilibrium, Surplus
advertisement
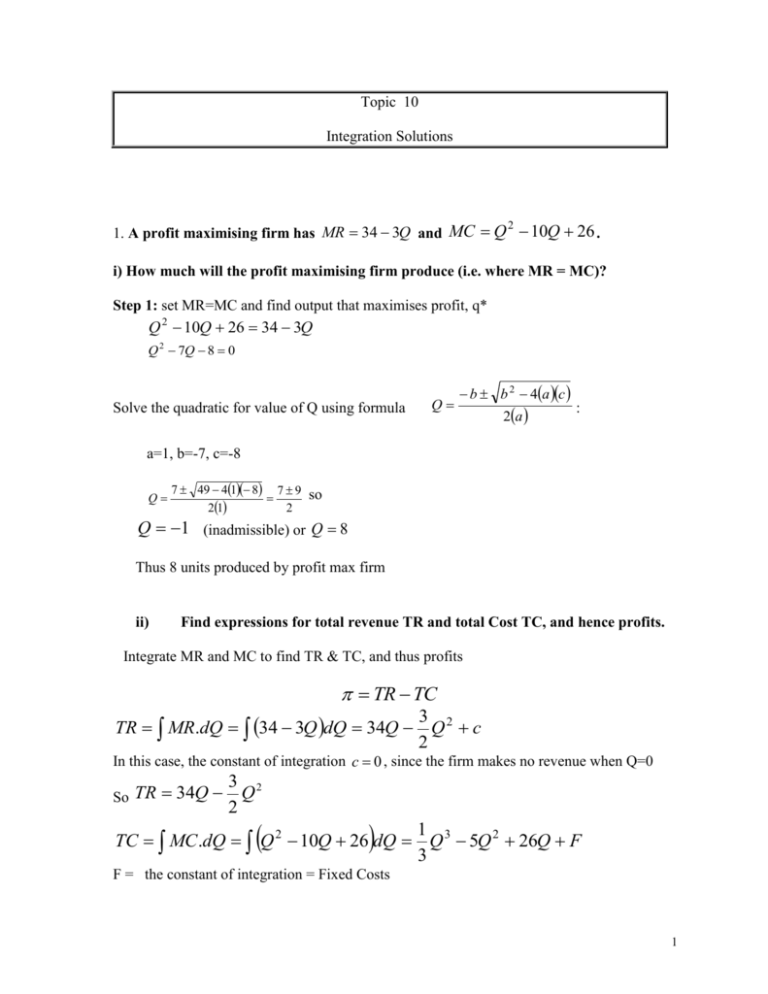
Topic 10 Integration Solutions 1. A profit maximising firm has MR 34 3Q and MC Q 10Q 26 . 2 i) How much will the profit maximising firm produce (i.e. where MR = MC)? Step 1: set MR=MC and find output that maximises profit, q* Q 2 10Q 26 34 3Q Q 2 7Q 8 0 Solve the quadratic for value of Q using formula Q b b 2 4a c 2a : a=1, b=-7, c=-8 Q 7 49 41 8 7 9 21 2 so Q 1 (inadmissible) or Q 8 Thus 8 units produced by profit max firm ii) Find expressions for total revenue TR and total Cost TC, and hence profits. Integrate MR and MC to find TR & TC, and thus profits TR TC 3 TR MR.dQ 34 3Q dQ 34Q Q 2 c 2 In this case, the constant of integration c 0 , since the firm makes no revenue when Q=0 So TR 34Q 3 2 Q 2 1 TC MC .dQ Q 2 10Q 26 dQ Q 3 5Q 2 26Q F 3 F = the constant of integration = Fixed Costs 1 = TR - TC 3 2 1 3 34Q Q 2 Q 3 5Q 2 26Q F 1 3 7 2 Q 3 Q 2 8Q F iii) What level of profits will the firm make when producing the profit maximising level of output (found in part (i)) substitute in q* to TR and TC to get profit max values when producing q* Substituting in Q 8 for profit max. 1 3 7 2 8 8 88 170 2 224 64 117 1 F 3 2 3 3 iv) Find the level of Fixed Costs at which the firm will make zero profits. Set profit =0 (thus TR – TC = 0), & solve for F Setting 0 , gives Thus, value of F at = 0 is 1 0 117 F 3 F 117 1 3 2. A firm which has NO fixed costs has MC and MR given as follows: MC=2Q2 – 6Q + 6; MR = 22 – 2Q; Find total profit for profit maximising firm when MR=MC? Solution: 1) Find profit max output Q where MR = MC 2 22 – 2Q = 2Q2 – 6Q + 6 gives Q2 – 2Q – 8 = 0 Solve quadratic for Q, by using formula, or (Q - 4)(Q + 8) = 0 so Q = +4 or Q =-2 so Q = +4 (since Q=-2 inadmissable) 2) Find TR and TC TR( Q ) 22 2QdQ TR( Q ) 22 dQ 2 QdQ TR( Q ) 22Q Q2 c TR = c when Q=0; but TR = 0 when Q = 0; so therefore c = 0 so TR = 22Q – Q2 MC = f (Q) = 2Q2 – 6Q + 6 TC ( Q ) 2Q 2 6Q 6 dQ TC ( Q ) 2 Q 2dQ 6 QdQ 6 dQ 2 TC ( Q ) Q3 3Q 2 6Q F 3 2 3 2 (from question) so…. TC( Q ) Q 3Q 6Q 3 F = Fixed Cost = 0 3. Find profit = TR-TC, by substituting in value of q* when MR = MC Profit = TR – TC TR if q*=4: TC if q* =4: 22(4) - 42 = 88-16 = 72 2 /3 (4)3 – 3(4)2 + 6(4) = 2/3(64) – 48 + 24 = 182/3 so total profit when producing at MR=MC at q*=4 is TR – TC = 72 - 182/3 = 53 1/3 3. The inverse demand and supply functions for a good are, respectively: p D 100 1 q 2 and p S 20 q 3 (a) Find the market equilibrium values of p and q. For market equilibrium, pD 100 21 q pS 20 q So 120 = 3/2 q Hence 3q = 240 and so q = 80 Since q = 80 and p = 100 – ½ (80) = 60 Equilibrium q = 80 and p = 60 (b) Sketch the diagram and highlight Consumer and Producer Surplus at equilibrium Demand curve: p D 100 1 q so intercepts: at q = 0, p = 100 so (0,100) and at p = 2 0 , q = 50 so (50, 0) Supply curve: p S 20 q , so intercept: at q = 0, p = - 20 CS S P 100 p*=60 PS D 0 -20 q* = 80 50 Q (c) Find the consumers’ surplus when the market is in equilibrium. Difference between value to consumers and to the market…. Area above price line and under Demand curve 4 CS Dq dq p * q * q* 0 80 Consumer surplus (CS) (100 21 q )dq pq 0 100q 41 q 2 100q 41 q 2 80 60 8000 1600 4800 1600 q 80 q 0 d) Find the producers’ surplus when the market is in equilibrium Producer Surplus Difference between market value and total cost to producers… area below price line and above Supply curve PS p * q * S q .dq q* 0 PS 6080 80 0 20 qdQ PS 4800 20q 12 q 2 80 0 PS 4800 20(80) 12 (6400) 200 12 0 PS 4800 (1600 3200) 4800 1600 3200 3200 (e) What is the measure of Total Surplus? Total Surplus = CS + PS = 1600 + 3200 = 4800 5
