Keith surveyed the third grade to find out which pet is most popular
advertisement
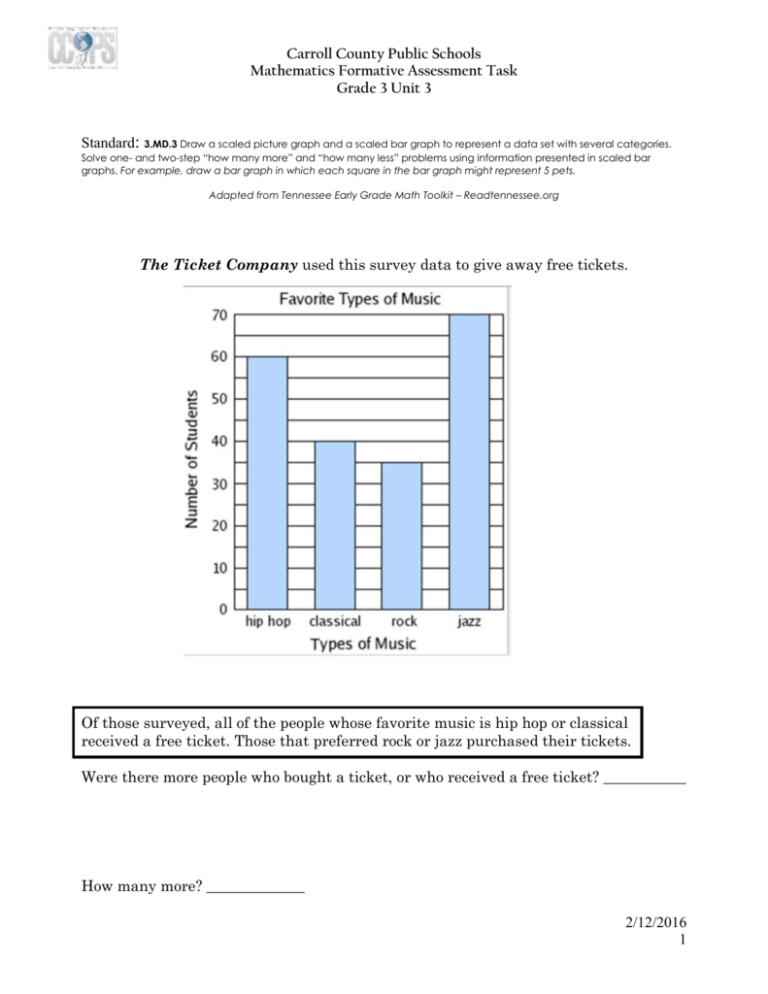
Carroll County Public Schools Mathematics Formative Assessment Task Grade 3 Unit 3 Standard: 3.MD.3 Draw a scaled picture graph and a scaled bar graph to represent a data set with several categories. Solve one- and two-step “how many more” and “how many less” problems using information presented in scaled bar graphs. For example, draw a bar graph in which each square in the bar graph might represent 5 pets. Adapted from Tennessee Early Grade Math Toolkit – Readtennessee.org The Ticket Company used this survey data to give away free tickets. Of those surveyed, all of the people whose favorite music is hip hop or classical received a free ticket. Those that preferred rock or jazz purchased their tickets. Were there more people who bought a ticket, or who received a free ticket? ___________ How many more? _____________ 2/12/2016 1
