Odor detection using GC/SAW zNose
advertisement
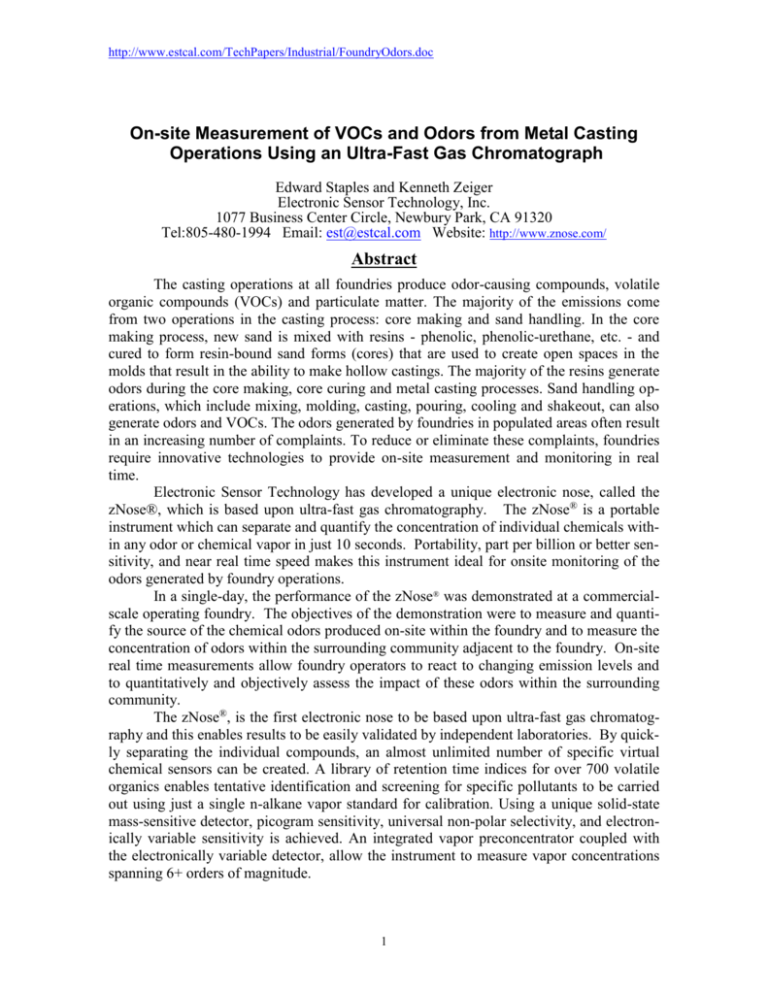
http://www.estcal.com/TechPapers/Industrial/FoundryOdors.doc On-site Measurement of VOCs and Odors from Metal Casting Operations Using an Ultra-Fast Gas Chromatograph Edward Staples and Kenneth Zeiger Electronic Sensor Technology, Inc. 1077 Business Center Circle, Newbury Park, CA 91320 Tel:805-480-1994 Email: est@estcal.com Website: http://www.znose.com/ Abstract The casting operations at all foundries produce odor-causing compounds, volatile organic compounds (VOCs) and particulate matter. The majority of the emissions come from two operations in the casting process: core making and sand handling. In the core making process, new sand is mixed with resins - phenolic, phenolic-urethane, etc. - and cured to form resin-bound sand forms (cores) that are used to create open spaces in the molds that result in the ability to make hollow castings. The majority of the resins generate odors during the core making, core curing and metal casting processes. Sand handling operations, which include mixing, molding, casting, pouring, cooling and shakeout, can also generate odors and VOCs. The odors generated by foundries in populated areas often result in an increasing number of complaints. To reduce or eliminate these complaints, foundries require innovative technologies to provide on-site measurement and monitoring in real time. Electronic Sensor Technology has developed a unique electronic nose, called the zNose®, which is based upon ultra-fast gas chromatography. The zNose® is a portable instrument which can separate and quantify the concentration of individual chemicals within any odor or chemical vapor in just 10 seconds. Portability, part per billion or better sensitivity, and near real time speed makes this instrument ideal for onsite monitoring of the odors generated by foundry operations. In a single-day, the performance of the zNose® was demonstrated at a commercialscale operating foundry. The objectives of the demonstration were to measure and quantify the source of the chemical odors produced on-site within the foundry and to measure the concentration of odors within the surrounding community adjacent to the foundry. On-site real time measurements allow foundry operators to react to changing emission levels and to quantitatively and objectively assess the impact of these odors within the surrounding community. The zNose®, is the first electronic nose to be based upon ultra-fast gas chromatography and this enables results to be easily validated by independent laboratories. By quickly separating the individual compounds, an almost unlimited number of specific virtual chemical sensors can be created. A library of retention time indices for over 700 volatile organics enables tentative identification and screening for specific pollutants to be carried out using just a single n-alkane vapor standard for calibration. Using a unique solid-state mass-sensitive detector, picogram sensitivity, universal non-polar selectivity, and electronically variable sensitivity is achieved. An integrated vapor preconcentrator coupled with the electronically variable detector, allow the instrument to measure vapor concentrations spanning 6+ orders of magnitude. 1 http://www.estcal.com/TechPapers/Industrial/FoundryOdors.doc Direct Air Sampling The zNose®, shown in Figure 1, is able to directly sample ambient air and perform analytical measurements of volatile organic vapors and odors in near real time. Vapors are sampled, and the concentration of individual chemicals measured in 10 seconds or near real time. Controlling the sample time of the preconcentrator coupled with electronically variable sensitivity of the solid-state detector, allow the instrument to measure vapor concentrations spanning 6+ orders of magnitude. An internal pump samples ambient air at ½ milliliter per second and direct air samples are typically less than 20 milliliters. Using direct air sampling the instrument is able to achieve sensitivity in the ppb and even ppt concentration ranges for hydrocarbons spanning the range C4 to C24. Figure 1- Portable zNose® odor analyzing system and battery operated air sampler. Indirect Air Sampling Concentrating vapors from large air volumes before analyzing is an indirect sampling method and can increase the measurement sensitivity of the zNose® by 100-1000 times over that which can be achieved with direct sampling alone. With this method, a handheld battery operated air sampler is used to first collect and concentrate odors in a Tenax® filled metal probe (Figure 1). Large volumes of ambient air, 1-10 liters, at remote sites can be quickly sampled without breakthrough. After sampling the metal probe is inserted into the inlet of the zNose® where the collected organic compounds are thermally desorbed and measured. Indirect sampling is ideal for collecting odors at remote sites such as within the community surrounding foundries. 2 http://www.estcal.com/TechPapers/Industrial/FoundryOdors.doc How the zNose® Quantifies the Chemistry of Odors A simplified diagram of the zNose system shown in Figure 2 consists of two parts. One section uses helium gas, a capillary tube (GC column) and a solid-state detector. The other section consists of a heated inlet and pump, which samples ambient air. Linking the two sections is a “loop” trap, which acts as a preconcentrator when placed in the air section (sample position) and as an injector when placed in the helium section (inject position). Operation is a two-step process. Ambient air (aroma) is first sampled and organic vapors collected (preconcentrated) on the trap. After sampling the trap is switched into the helium section where the collected organic compounds are injected into the helium gas. The organic compounds pass through a capillary column with different velocities and thus individual chemicals exit the column at characteristic times. As they exit the column they are detected and quantified by a solid-state detector. An internal high-speed gate array microprocessor controls the taking of sensor data, which is transferred to a user interface or computer using an RS-232 or USB connection. Calibration is accomplished using a single n-alkane vapor standard. A library of retention times of known chemicals indexed to the n-alkane response (Kovats indices) allows for machine independent measurement and compound identification. The time derivative of the sensor spectrum yields the spectrum of column flux, commonly referred to as a chromatogram. The chromatogram responses (Figure 3) of n-alkane vapors (C6 to C14) provide a series of standard retention times, which can be used as an independent reference. . Figure 2- Simplified diagram of the zNose® showing an air section on the right and a helium section on the left. A loop trap preconcentrates organics from ambient air in the sample position and injects them into the helium section when in the inject position. 3 http://www.estcal.com/TechPapers/Industrial/FoundryOdors.doc Figure 3- Vertically offset replicate chromatograms of alkane vapors used for referencing chromatogram retention times Calibration Standards Injecting chemical standards into a tedlar bag filled with a known volume of air (1liter) produces a calibration vapor standard. Direct or indirect sampling of the standard vapor is used to calibrate the response for each compound. Shown in Figure 4 are three replicate chromatograms used to calibrate the response for benzene, trichloroethylene, toluene, tetrachloroethene, ethylbenzene, o-xylene, and phenol. The standard vapor was sampled for 5-seconds with a 20oC detector for each chromatogram. Instrument software automatically displays the Kovats index and concentration of each compound. Figure 4- Response to calibration vapors. 4 http://www.estcal.com/TechPapers/Industrial/FoundryOdors.doc Indirect Odor Measurements Calibrating indirect sampling methods is shown in Figure 5-A. After a known amount of vapor has been preconcentrated the collection probe is transferred to the inlet of the instrument (5-B) and a temperature controlled heater (5-C) used to desorb the trapped compounds so they can be transferred into the zNose® for analysis.. Figure 5- Standard vapors from a tedlar bag are collected by sample probe (A) which is then inserted into the inlet of the instrument (B) and heated to release the absorbed compounds (C) for analysis. Adding a high flow preconcentrator greatly increases the sensitivity of odor measurements compared to direct sampling. This is demonstrated in Figure 6 where the response in counts from direct and indirect sampling using nearly equal sample times is compared. Using the high flow sampler a sensitivity gain of 30X is achieved. Figure 6- Sensitivity comparison of a 10 second direct sampling measurement with a 15 second high flow sampling measurement using the remote vapor collector. 5 http://www.estcal.com/TechPapers/Industrial/FoundryOdors.doc Even higher sensitivity is possible using increased sample times. Sensitivity and response factors using a 1-minute sample of a low concentration vapor standard with the same six analytes is shown in Figure 7. The minimum detection level of benzene based upon signal to noise is near 1 ppb while that of o-xylene is even lower at 50 ppt. Even lower detection levels can be achieved by increasing sample time. Figure 7-1 min sample of a low concentration 6-compound standard odor mixture from tedlar bag. Foundry Chemical Odors The majority of the foundry emissions come from two operations in the casting process: core making and sand handling. In the core making process, new sand is mixed with resins - phenolic, phenolic-urethane, etc. - and cured to form resin-bound sand forms (cores) that are used to create open spaces in the molds that result in the ability to make hollow castings. The resins generate odors during the core making, core curing and metal casting processes. Following installation of a Sonoperoxone®-scrubber system approximately 17 phenolic compounds were identified as potential sources of foundry odors1. A comparison of emissions concentration data with odor threshold values can be useful in determining the odor potential of emitted compounds. Nuisance 1 Figure 8- Foundry odors produced by molten metal pouring into sand molds. An Innovative Integrated Systems Approach to Non-Incineration Destruction of Benzene, VOCs and odors from Metal Casting Operations, AQMD Final Report, Contract No. 02307 6 http://www.estcal.com/TechPapers/Industrial/FoundryOdors.doc odors are often defined as compound concentrations more than five times their odor threshold value. For example if a phenol or cresol concentration were 500 ppb they would strongly be suspected of causing nuisance odors because their odor threshold is approximately 40 ppb. After review of previous measurements taken at the foundry, published literature from similar foundries, and MSDS sheets for foundry raw materials such as core making sand and adhesive resin chemistry, a list of organic compounds which might be found at the foundry was created. The Kovats index of each compound was obtained from a NIST database2 and the results are shown in Table I. The Kovats indices are a useful parameter for performing tentative compound identification and screening using n-alkane standards. Table I- Foundry Compound List Compound 1-propene 2-methyl 1-propene acetaldehyde 1,1-dimethyl- Cyclopropane 2-methylbutane pentane Trimethylamine Benzene 2-methylpentane Triethylamine 1-Pentanamine Toluene 1,4-dimethylbenzene nonane Phenol o-cresol 1-methyl-3-(1-methylethyl)-benzene dimethyl succinate m-cresol p-cresol 2,4-dimethylphenol 4-Pyridinamine Hexamine 1-methylnaphthalene 2 KI 310 410 427 460 475 500 503 655 560 680 726 750 875 900 976 1030 1030 1034 1075 1080 1150 1158 1220 1310 Figure 9- Sand Core Molding also produces odors NIST Chemistry WebBook, http://webbook.nist.gov/chemistry/ 7 http://www.estcal.com/TechPapers/Industrial/FoundryOdors.doc Compound Identification: Chemical Odor Library Instrument software contains a library of over 700 chemical compounds and their human odor descriptors based upon Kovat’s indices. Clicking on an unknown peak displays the nearest library compound entry. Human odor perceptions for each compound can help in identification of the compound. The library is user-expandable and a typical entry for the phenol is shown in Figure 10. Figure 10- A chemical library based upon Kovat’s indices and human odor perception is useful for identification of unknown compounds. Calibration for Concentration Measurements Measurement sensitivity for the zNose is expressed in counts per ppbv (vapor pressure) and is a linear function of sample volume (time) and an inverse exponential function of detector temperature. Although the zNose® uses a non-specific detector, its sensitivity is inversely proportional to the Kovats indices. Both parameters are variable and user selected within the context of a measurement method. For demonstration purposes a 20oC detector and a 20 second sample time were used in all ambient air measurements within the foundry. Sampling a tedlar bag vapor standard of benzene, trichloroethylene, toluene, tetrachloroethene, ethylbenzene, and o-xylene was used to calibrate the measurement method. These measurements provided representative response factors over the range C6 to C9. Direct injection of 1.2 ng phenol and 1.26 ng naphthalene standards was used to derive response factors for the less volatile compounds in the range C9 to C13. The results are shown in Figure 11. Response factors and measurement methods were stored in individual peak files and method files, which are necessarily linked. An unlimited number of different measurement methods and peak files could be selected as needed for ambient air measurements. 8 http://www.estcal.com/TechPapers/Industrial/FoundryOdors.doc Figure 11- Method response factor vs. Kovats index. Core Room Office Odors Ambient air measurements within the foundry began in an office near the core room. A 10-second chromatogram of office odors is shown in Figure 12. Initial measurements simply identified peaks by their index e.g. odor 969, as shown in the top table. Using listed compound indices a tentative identification was done and the compounds are listed together with their concentrations in the bottom table. Figure 12-Chromatogram of core room office odors. (10 kcts/sec scale) 9 http://www.estcal.com/TechPapers/Industrial/FoundryOdors.doc Odors Near 620 Sand Molding Operations Odor chemistry was evaluated near a 620 sand molding machine. Odors near the machine (4 ft) and in an isle approximately 15 feet away were measured by direct sampling with the zNose. Representative results are shown in Figure 14. Phenol concentration was approximately 32 ppb in the isle of the core room, but increased sharply near the machine to 1.3 ppm. The concentration of amines also increased near the machine. Figure 13- 620 Sand machines Figure 14- Odors at 620 sand mold machine. Note different vertical scales of 1000 and 30 kcts/sec are used to display chromatogram results. 10 http://www.estcal.com/TechPapers/Industrial/FoundryOdors.doc Odors Near 740 Sand Molding Operations Odor chemistry was evaluated near a 740 sand machine. Odors near the machine (4 ft) and in an isle approximately 15 feet away were measured by direct sampling with the zNose. Representative results are shown in Figure 15. Phenol concentration was approximately 100 ppb in the isle of the core room near the 740 sand machines and increased sharply near the machine to over 500 ppb. Figure 15- Odors near 740 sand machines. Note different vertical scales of 500 and 100 kcts/sec are used to display chromatogram results. 11 http://www.estcal.com/TechPapers/Industrial/FoundryOdors.doc Odors from 620 and 740 Sand Samples Ten-gram samples of 620 and 740 sand were placed in 40-milliliter septa-sealed vials and their headspace vapors tested with the zNose. The results shown in Figure 16 demonstrate that the odor chemistry is entirely dominated by 2-5 ppm phenol and 12-16 ppm of triethylamine. Figure 16- Odors from sand samples in septa sealed vials. Note different vertical scales of 100 and 200 kcts/sec are used to display chromatogram results. 12 http://www.estcal.com/TechPapers/Industrial/FoundryOdors.doc Odors from Hard Mold Operations Ambient air near a hard molding machine were measured and found to contain a number of phenolic compounds from sand, which contained phenolic resins. The chemistry of ambient air near the hard molding machine is shown on the left of Figure 17. The chromatogram on the right was obtained from testing headspace vapors from 10 grams of phenolic sand placed in a 40-milliliter septa sealed vial. In addition to phenol there were many higher molecular weight phenolic compounds produced. Figure 17- Odors in Hard Mold Area of foundry 13 http://www.estcal.com/TechPapers/Industrial/FoundryOdors.doc Odors from Hunter Molding Machine Ambient air near a Hunter molding machine was measured and compared to odors near the actual molded part. Results are shown in figure 18. The chemistry of ambient air near the Hunter molding machine is shown on the left of Figure 18. The chromatogram on the right was obtained from testing headspace vapors within 6-inches of an actual mold. It is clear from these results that no odors were coming from the molded part but rather were only those in the ambient background air. Figure 18- Odors from Hunter Mold Machine 14 http://www.estcal.com/TechPapers/Industrial/FoundryOdors.doc Odor Measurements in Surrounding Community Odor measurements were carried out in the surrounding community by collecting ambient air samples in a tenax filled desorber tube using a small handheld sample pump. A sample flow rate of 300 mL/min was used and the total volume sampled was 600 milliliters. The sample tube was returned to the onsite location, immediately inserted into the inlet of the zNose®, and the contents analyzed. An example of ambient air odors collected on the corner of Easto and Hickman streets is shown in Figure 19. For comparison vertically offset odor chromatograms from phenolic sand, 620 core, and 740 core locations are also shown. The concentrations of the phenolic compounds were all in the low ppt range but amine odors were noticeably higher in the ppb concentration range. Figure 19- Analysis of odors on corner of Easto and Hickman Streets. 15 http://www.estcal.com/TechPapers/Industrial/FoundryOdors.doc Odors in ambient air were indirectly collected and measured at the Ambledillo street cul-de-sac and the results are shown in Figure 20. For comparison vertically offset odor chromatograms from phenolic sand, 620 core, and 740 core locations are also shown. The concentrations of the phenolic compounds were all in the low ppt range but amine odors were again noticeably higher, well in the ppb concentration range. Figure 20- Analysis of odors on cul-de-sac of Ambledillo Street. 16 http://www.estcal.com/TechPapers/Industrial/FoundryOdors.doc Ambient air odors were indirectly collected and measured at across the street from the foundry and results are shown in Figure 21. For comparison vertically offset odor chromatograms from phenolic sand, 620 core, and 740 core locations are also shown. As expected the concentration of phenol was higher than previous locations but still well below 1 ppb. The concentrations of other phenolic compounds were all in the low ppt range but amine odors were again noticeably higher, well in the ppb concentration range. Figure 21- Analysis of odors across street from foundry. 17 http://www.estcal.com/TechPapers/Industrial/FoundryOdors.doc Summary The casting operations at all foundries produce odor-causing compounds, volatile organic compounds (VOCs) and particulate matter. The majority of the emissions come from two operations in the casting process: core making and sand handling. The odors generated by foundries in populated areas often result in an increasing number of complaints. To reduce or eliminate these complaints, foundries require innovative technologies to provide on-site measurement and monitoring in real time. To meet this need Electronic Sensor Technology has developed a unique electronic nose, called the zNose®, which can separate and quantify the concentration of individual chemicals within any odor or chemical vapor in just 10 seconds. Portability, part per billion or better sensitivity, and near real time speed makes this instrument ideal for onsite monitoring of the odors generated by foundry operations. The performance of the zNose® was demonstrated at a commercial-scale operating foundry where it was used to measure and quantify the source of the chemical odors produced on-site within the foundry and to measure the concentration of odors within the surrounding community adjacent to the foundry. In a single day of testing over 125 measurements were performed onsite. Odors within the foundry were found to be a mixture of amines and phenolic compounds primarily produced from the resins used for sand molds. The most prominent compound was phenol. Phenol concentrations within the foundry varied from 40 ppbv to over 5 ppmv. Amines such as triethylamine were also detected at ppm levels. Concentrations of phenolic compounds in the surrounding neighborhood were found to range from 10-250 pptv while amine concentrations ranged from 1 to 16 ppbv. The zNose® is a promising new tool for detection and analysis of foundry odors. Using a battery powered remote sampler to collect and concentrate environmental samples in the surrounding community, ppt and lower sensitivity in near real time has been demonstrated. Because the measurements are based upon gas chromatography, independent laboratory testing can be used to validate findings. Recommendations for further studies are (1) to profile the spatial distribution of foundry odors by adding a small GPS receiver (zNose® accessory) and (2) to use the zNose® to monitor scrubber input and output concentrations in real time. On-site real time odor measurements allow foundry operators to quickly react to changing emission levels and to quantitatively and objectively assess the impact of these odors within the surrounding community. 18
![Shark Electrosense: physiology and circuit model []](http://s2.studylib.net/store/data/005306781_1-34d5e86294a52e9275a69716495e2e51-300x300.png)


