RSC Article Template
advertisement

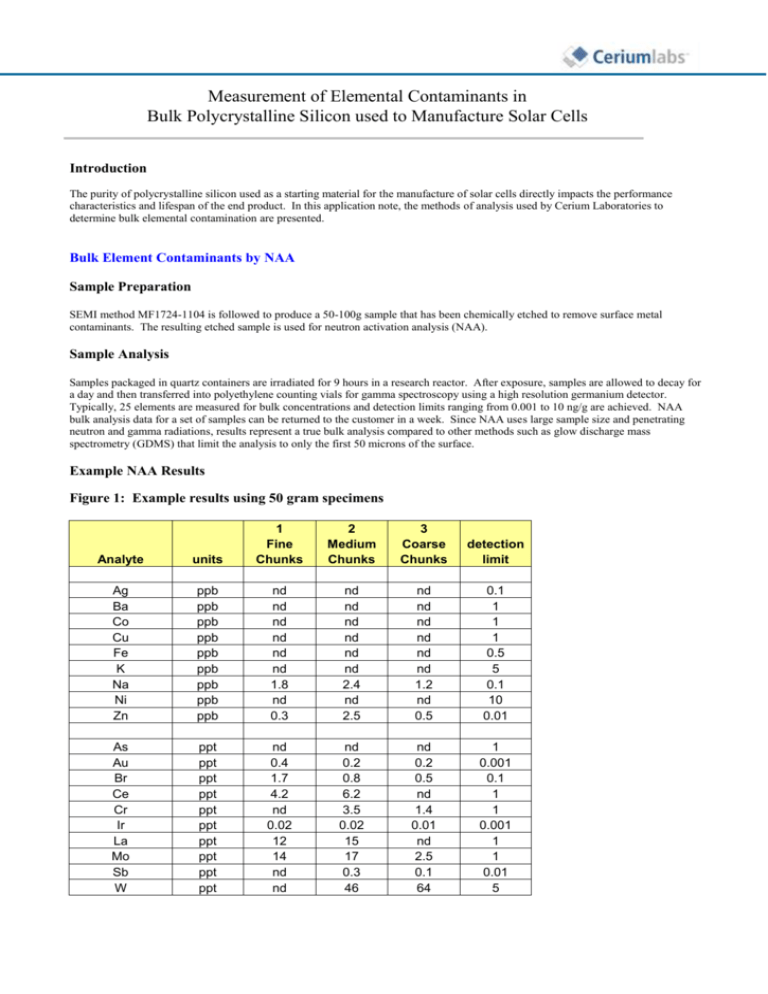
Measurement of Elemental Contaminants in Bulk Polycrystalline Silicon used to Manufacture Solar Cells Introduction The purity of polycrystalline silicon used as a starting material for the manufacture of solar cells directly impacts the performance characteristics and lifespan of the end product. In this application note, the methods of analysis used by Cerium Laboratories to determine bulk elemental contamination are presented. Bulk Element Contaminants by NAA Sample Preparation SEMI method MF1724-1104 is followed to produce a 50-100g sample that has been chemically etched to remove surface metal contaminants. The resulting etched sample is used for neutron activation analysis (NAA). Sample Analysis Samples packaged in quartz containers are irradiated for 9 hours in a research reactor. After exposure, samples are allowed to decay for a day and then transferred into polyethylene counting vials for gamma spectroscopy using a high resolution germanium detector. Typically, 25 elements are measured for bulk concentrations and detection limits ranging from 0.001 to 10 ng/g are achieved. NAA bulk analysis data for a set of samples can be returned to the customer in a week. Since NAA uses large sample size and penetrating neutron and gamma radiations, results represent a true bulk analysis compared to other methods such as glow discharge mass spectrometry (GDMS) that limit the analysis to only the first 50 microns of the surface. Example NAA Results Figure 1: Example results using 50 gram specimens Analyte units 1 Fine Chunks 2 Medium Chunks 3 Coarse Chunks detection limit Ag Ba Co Cu Fe K Na Ni Zn ppb ppb ppb ppb ppb ppb ppb ppb ppb nd nd nd nd nd nd 1.8 nd 0.3 nd nd nd nd nd nd 2.4 nd 2.5 nd nd nd nd nd nd 1.2 nd 0.5 0.1 1 1 1 0.5 5 0.1 10 0.01 As Au Br Ce Cr Ir La Mo Sb W ppt ppt ppt ppt ppt ppt ppt ppt ppt ppt nd 0.4 1.7 4.2 nd 0.02 12 14 nd nd nd 0.2 0.8 6.2 3.5 0.02 15 17 0.3 46 nd 0.2 0.5 nd 1.4 0.01 nd 2.5 0.1 64 1 0.001 0.1 1 1 0.001 1 1 0.01 5 Bulk Element Contaminants by SIMS Sample Preparation Elements that cannot be analyzed by NAA such as B, P, Al and Ti are measured using magnetic sector secondary ion mass spectrometry (SIMS). For this purpose a single piece of polysilicon is polished on both sides to provide a smooth surface for SIMS analysis. Sample Analysis A Cameca 6f dynamic SIMS is used to depth profile the elements described above. Detection limits, in atoms per cc, are typically 5E12 for B, 5E13 for P, 7E12 for Al and 5E12 for Ti. Results of the SIMS analysis are cross-calibrated to prompt gamma neutron activation analysis (PGNAA) at NIST. Example SIMS Results Figure 2: Example results for test samples Analyte units 1 Fine Chunks C O B P Al Ti ppma ppma ng/g ng/g ng/g ng/g nd 3.10 1.30 nd nd nd 2 Medium Chunks 3 Coarse Chunks detection limit 0.36 4.00 nd nd nd nd nd 2.40 nd nd nd nd 0.30 0.50 0.05 1.00 0.15 0.17 2


