Supplemental Information (doc 581K)
advertisement
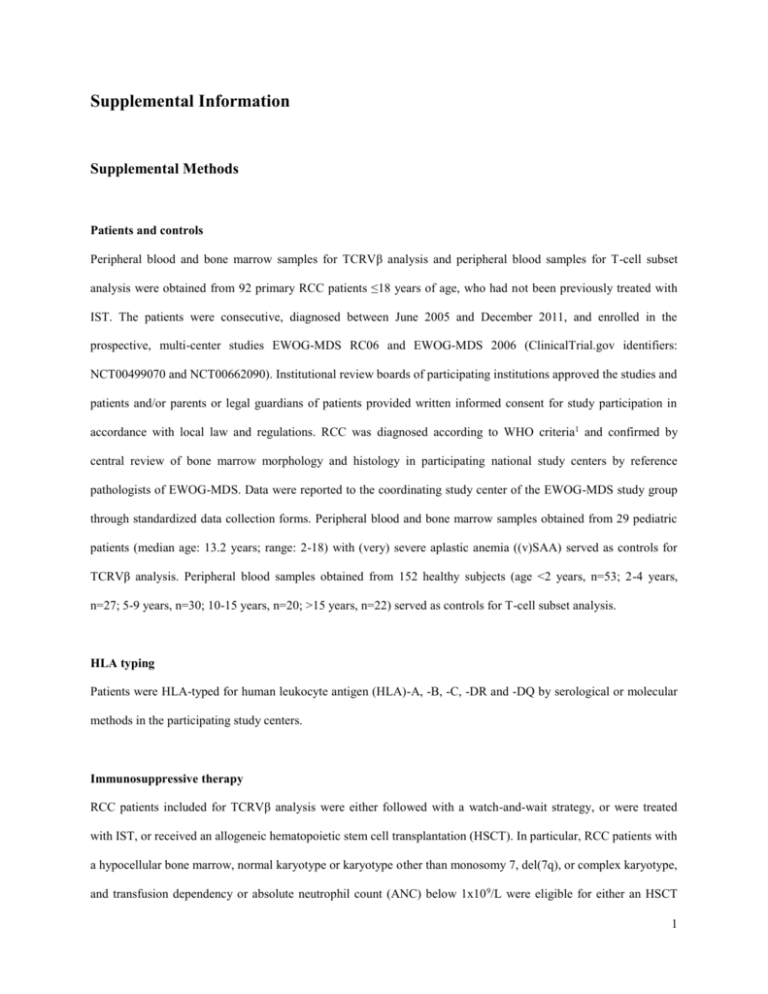
Supplemental Information Supplemental Methods Patients and controls Peripheral blood and bone marrow samples for TCRVβ analysis and peripheral blood samples for T-cell subset analysis were obtained from 92 primary RCC patients ≤18 years of age, who had not been previously treated with IST. The patients were consecutive, diagnosed between June 2005 and December 2011, and enrolled in the prospective, multi-center studies EWOG-MDS RC06 and EWOG-MDS 2006 (ClinicalTrial.gov identifiers: NCT00499070 and NCT00662090). Institutional review boards of participating institutions approved the studies and patients and/or parents or legal guardians of patients provided written informed consent for study participation in accordance with local law and regulations. RCC was diagnosed according to WHO criteria1 and confirmed by central review of bone marrow morphology and histology in participating national study centers by reference pathologists of EWOG-MDS. Data were reported to the coordinating study center of the EWOG-MDS study group through standardized data collection forms. Peripheral blood and bone marrow samples obtained from 29 pediatric patients (median age: 13.2 years; range: 2-18) with (very) severe aplastic anemia ((v)SAA) served as controls for TCRVβ analysis. Peripheral blood samples obtained from 152 healthy subjects (age <2 years, n=53; 2-4 years, n=27; 5-9 years, n=30; 10-15 years, n=20; >15 years, n=22) served as controls for T-cell subset analysis. HLA typing Patients were HLA-typed for human leukocyte antigen (HLA)-A, -B, -C, -DR and -DQ by serological or molecular methods in the participating study centers. Immunosuppressive therapy RCC patients included for TCRVβ analysis were either followed with a watch-and-wait strategy, or were treated with IST, or received an allogeneic hematopoietic stem cell transplantation (HSCT). In particular, RCC patients with a hypocellular bone marrow, normal karyotype or karyotype other than monosomy 7, del(7q), or complex karyotype, and transfusion dependency or absolute neutrophil count (ANC) below 1x10 9/L were eligible for either an HSCT 1 from an HLA-matched donor or for IST. IST consisted of horse-ATG (Lymphoglobulin, Sangstat/Genzyme) until 2007 (0.75 ml/kg/day for 8 days); rabbit-ATG (Thymoglobulin, Sangstat/Genzyme or ATG-Fresenius, Fresenius Biotech) from 2007 (3.75 mg/kg/day for 5 days), prednisolone (1-2 mg/kg/day for 14 days, tapered down from day 14 and discontinued on day 28), CsA (5 mg/kg/day with subsequent dose adjustment to maintain blood levels of 100-150 ng/mL by monoclonal assay or 200-400 ng/mL by polyclonal assay, until day 180 with subsequent slow dose tapering), and granulocyte colony-stimulating factor (5μg/kg/day until day 28 in case of ANC below 0.5x10⁹/L). Response to IST was evaluated on day 180. Complete response was defined as transfusion independency, hemoglobin level within the age-adjusted normal range, platelet count above 150×10 9/L, and ANC above 1.5×10⁹/L; partial response was defined as transfusion independency, platelet count above 20×10 9/L, and ANC above 0.5×10⁹/L; no response was defined when neither the partial nor the complete response criteria were fulfilled. TCRVβ analysis by heteroduplex PCR TCRVβ CDR3 repertoire analysis by heteroduplex PCR was performed as previously described. 2,3 In brief, RNA was isolated from peripheral blood and bone marrow mononuclear cells, separated by density gradient centrifugation. Following cDNA synthesis, TCRB (Vβ-Cβ) PCR, using TCRVβ specific primers for family 1 through 25, was applied. Resulting PCR products were subjected to heteroduplex analysis to determine TCRVβ CDR3 heterogeneity. Skewing was defined when 2 or more TCRVβ families showed an oligoclonal pattern on heteroduplex gel. This cut-off was based on healthy controls, in whom skewing in more than one TCRVβ family was present in only 2 of 18 cases (11%). Skewing was further subdivided into weak skewing, when an oligoclonal pattern was found in 2-5 TCRVβ families, and strong skewing, when an oligoclonal pattern was found in more than 5 TCRVβ families.3 T-cell subset analysis by flow cytometry Peripheral blood samples were collected in heparinized tubes and sent to the Erasmus MC, Rotterdam, The Netherlands. Fresh peripheral blood samples were lysed with NH 4Cl, cells were suspended in PBS/BSA and stained for 15 minutes at room temperature with CD45RO-FITC (UCHL1, DAKO, Glostrup, Denmark), CD45RA-PE (2H4, Beckman Coulter, Woerden, The Netherlands), CD3-PerCP (SK7, BD Biosciences, Erembodegem, Belgium), 2 CD4-PerCP-Cy5.5 (SK3, BD Biosciences), CD27-APC (L128, BD Biosciences), and CD8-APC-Cy7 (SK1, BD Biosciences) (tube 1); or with CD57-FITC (HNK-1, BD Biosciences), CD56-PE (C5.9, Zebra/DAKO, Enschede, The Netherlands), HLA-DR-PerCP (L243, BD Biosciences), CD3-PE-Cy7 (SK7, BD Biosciences), CD38-APC (HB7, BD Biosciences), and CD8-APC-Cy7 (SK1, BD Biosciences) (tube 2). Cells were acquired on a FACSCanto II flow cytometer (BD Biosciences), and data were analyzed using FlowJo software version 7.6.5 (Tree Star, Ashland, OR). After exclusion of debris and dead cells based on scatter and CD45 expression, lymphocytes were gated within all nucleated cells in a CD45 and forward scatter (FSC) versus side scatter (SSC) plot. T cells were defined as CD3+ cells within lymphocytes. Naïve, central memory, effector memory, and terminally differentiated effector CD4+ or CD8+ T lymphocytes were defined as CD45RO-CD27+, CD45RO+CD27+, CD45RO+CD27-, and CD45RO-CD27- cells, respectively.4 Activated CD8+ T lymphocytes were defined as the proportion of CD56 +, CD57+, HLA-DR+, or CD38+ CD8+ T cells. Lymphocyte and T-cell subset distributions in RCC patients and healthy controls were compared after categorizing patients and controls into age groups as previously published (<2 years, 2-4 years, 5-9 years, 10-15 years, >15 years),5 while lymphocyte and T-cell subset distributions in skewed and nonskewed RCC patients were compared after normalization according to age group using Z-scores as described below. Statistical analyses Statistical analyses were performed with SPSS 20 (IBM, Chicago, IL) and GraphPad Prism 6 (GraphPad Software, Inc., La Jolla, CA). Categorical variables were compared using the Chi-square test or Fisher’s exact test. Continuous variables were compared using the Mann-Whitney-U test or the Kruskal-Wallis test when more than two groups were compared. To compare relative lymphocyte and T-cell subset distributions between RCC patients with and without a skewed T-cell repertoire, taking age-dependent changes in into account, Z-scores were calculated as Z = (X–μ)/σ, with X = raw score, μ = mean of age-matched control group, σ = standard deviation of age-matched control group. All reported P-values are two-sided and were considered statistically significant when <0.05; P-values >0.1 were reported as non-significant (NS), whereas those between 0.05 and 0.1 were reported in detail. 3 Supplemental Figures Figure S1. Relative T-cell subset distribution in RCC patients and healthy controls. A) Lymphocytes within leukocytes. B) CD3+/T cells within lymphocytes. C) CD4+ within CD3+/ T cells. D) CD8+ within CD3+/ T cells. E) Naïve CD4+ T cells. F) Central memory CD4+ T cells. G) Effector memory CD4 + T cells. H) Terminally differentiated effector CD4+ T cells. I) Naïve CD8+ T cells. J) Central memory CD8+ T cells. K) Effector memory CD8+ T cells. L) Terminally differentiated effector CD8+ T cells. Lines indicate medians. Boxes extend from the 25th to 75th percentile; lines in the boxes indicate medians, whiskers indicate minimum and maximum values. Ns, not significant; *, P<0.05; **, P<0.01; ***, P<0.001, ****, P<0.0001. A B Lymphocytes ** 100 **** C D CD3+ within lymphocytes *** *** **** 100 **** *** CD4+ within CD3+ ** 60 60 60 % 40 40 40 20 20 20 0 <2y 2-4 y 5-9 y Control 10-15 y 2-4 y 5-9 y Control RCC 10-15 y ! 16 y ns * ns ns 80 * ns 5-9 y Control 10-15 y ! 16 y <2y 5-9 y 10-15 y ! 16 y Control RCC H ns 20 60 15 40 10 ** ns CD4+ CD45RO- CD27- (terminal effector) ns ns 10 * ns ns 5-9 y 10-15 y ! 16 y 9 4 % % % 2-4 y RCC 60 % ns 40 CD4+ CD45RO+ CD27- (effector memory) * ns 0 2-4 y G 80 ** 20 <2y CD4+ CD45RO+ CD27+ (central memory) * ns 80 60 RCC F CD4+ CD45RO- CD27+ (naive) 100 CD8+ within CD3+ ns 0 <2y ³ 16 y E ns % 80 * % 80 % 80 0 ns 100 40 3 2 20 0 <2y 2-4 y 5-9 y Control 10-15 y 20 5 0 0 <2y ! 16 y 2-4 y 5-9 y Control RCC I 10-15 y ! 16 y ns ns ns 2-4 y 5-9 y Control 10-15 y ns 60 ns ** <2y ! 16 y Control ns 40 80 ns ns CD8+ CD45RO- CD27- (terminal effector) ns 0 5-9 y Control 10-15 y RCC ! 16 y 5-9 y 10-15 y ! 16 y 20 10 2-4 y ns % % % % 20 20 <2y ns 30 20 0 ns 40 30 40 ns 50 40 60 RCC L CD8+ CD45RO+ CD27- (effector memory) ns 2-4 y RCC K CD8+ CD45RO+ CD27+ (central memory) ns 0 <2y RCC J CD8+ CD45RO- CD27+ (naive) 100 1 10 0 <2y 2-4 y 5-9 y Control 10-15 y RCC ! 16 y 0 <2y 2-4 y 5-9 y Control 10-15 y RCC ! 16 y <2y 2-4 y Control RCC 4 Figure S2. Absolute lymphocyte subset distribution in RCC patients and healthy controls. A) T cells. B) NK cells. C) B cells. After exclusion of debris and dead cells based on scatter and CD45 expression, lymphocytes were gated within all nucleated cells in a CD45 and forward scatter (FSC) versus side scatter (SSC) plot. Within lymphocytes, T cells were defined as CD3 + cells, NK cells as CD3-CD56+, and B cells as all other cells. Absolute cell counts were calculated from total white blood cell counts, which were measured with a Coulter Counter Z2 (Beckman Coulter, Woerden, The Netherlands). Ns, not significant; **, P<0.01, ****, P<0.0001. 8 ns ns ** ns 6 4 2 C NK cells 1.5 Cells x 106/mL Cells x 10 6/mL B T cells **** **** **** **** 1.0 0.5 0.0 0 <2y 2-4 y 5-9 y Control 10-15 y RCC ! 16 y B cells 3 Cells x 10 6/mL A **** **** **** ns 2 1 0 <2y 2-4 y 5-9 y Control 10-15 y RCC ! 16 y <2y 2-4 y 5-9 y Control 10-15 y ! 16 y RCC 5 Figure S3. Activation markers on CD8+ T cells in RCC patients. A) CD56+CD8+ T cells in RCC patients and age-matched healthy controls. B) CD57+CD8+ T cells in RCC patients and age-matched healthy controls. C) HLADR+CD8+ T cells in RCC patients and age-matched healthy controls. D) CD38+CD8+ T cells in RCC patients and age-matched healthy controls. Boxes extend from the 25th to 75th percentile; lines in the boxes indicate medians, whiskers indicate minimum and maximum values. Ns, not significant; ***, P<0.001. A B C CD56+ within CD8+ ns 50 ns ns D CD57+ within CD8+ ns ns 80 40 ns ns CD38+ within CD8+ HLADR+ within CD8+ ns ns 60 *** ns ns 40 5-9 y Control 10-15 y RCC ! 16 y 5-9 y 10-15 y ! 16 y % 20 0 0 0 2-4 y ns 40 20 20 <2y ns 60 % % % 40 20 0 ns 80 60 30 10 ns 100 <2y 2-4 y 5-9 y Control 10-15 y RCC ! 16 y <2y 2-4 y 5-9 y Control 10-15 y RCC ! 16 y <2y 2-4 y Control RCC 6 Supplemental Tables Table S1. Association of peripheral blood lymphocyte subsets (Z-scores of relative distribution) with bone marrow or peripheral blood TCRVβ CDR3 skewing. Vβ skewing BM Lymphocytes CD3+ CD4+ within CD3+ CD4+CD45RO-CD27+ within CD4+ CD4+CD45RO+CD27+ within CD4+ CD4+CD45RO+CD27- within CD4+ CD4+CD45RO-CD27- within CD4+ CD8+ within CD3+ CD8+CD45RO-CD27+ within CD8+ CD8+CD45RO+CD27+ within CD8+ CD8+CD45RO+CD27- within CD8+ CD8+CD45RO-CD27- within CD8+ CD4/CD8 ratio Vβ skewing PB No skewing (n=31) Skewing (n=16) 3.04 (-0.81-6.95) 2.18 (-0.97-4.33) -0.03 (-3.13-1.84) 0.6 (-2.34-3.69) -0.63 (-3.8-2.26) -0.6 (-1.59-2.33) -0.28 (-0.64-3.24) 0.08 (-1.84-2.43) 0.68 (-1.75-1.86) -0.74 (-1.85-2.32) -0.69 (-1.25-1.93) -0.33 (-0.95-7.19) -0.35 (-1.59-2.6) 3.36 (-1.59-6.99) 1.76 (-0.37-4.02) -0.65 (-2.47-0.98) 0.29 (-4.02-1.99) -0.35 (-2.17-3.45) 0.01 (-1.36-5.44) -0.21 (-0.52-1.62) 0.57 (-1.14-2.34) -0.15 (-2.85-2.44) -1.14 (-1.98-3.04) -0.19 (-1.05-3.83) 0.53 (-0.95-5.48) -0.73 (-1.57-1.17) P NS NS NS NS NS NS NS NS 0.047 NS NS 0.035 NS No skewing (n=32) Skewing (n=22) 3.45 (-0.81-6.95) 2.19 (-0.97-4.55) 0.13 (-2.26-1.84) 0.6 (-2.34-3.69) -0.48 (-3.74-2.26) -0.69 (-1.59-2.33) -0.31 (-0.65-3.24) -0.07 (-1.84-1.37) 0.8 (-1.44-2.44) -0.69 (-1.98-2.32) -0.65 (-1.25-1.93) -0.42 (-0.95-1.42) -0.26 (-1.26-2.6) 3.84 (-1.59-6.99) 2.13 (-0.37-4.02) -0.84 (-3.26-0.98) 0.5 (-4.02-3.19) -0.53 (-3.8-3.45) 0 (-1.36-5.44) -0.21 (-0.52-1.62) 0.77 (-1.14-5.47) -0.18 (-3.94-1.95) -0.88 (-1.96-3.04) -0.11 (-1.05-7.63) 0.85 (-0.76-7.19) -0.76 (-1.99-1.17) P NS NS 0.010 NS NS 0.077 0.032 0.011 0.002 NS 0.021 0.000 0.015 Table S2. Association of peripheral blood CD8+ T-cell activation markers (Z-scores of relative distribution) with bone marrow or peripheral blood TCRVβ CDR3 skewing. Vβ skewing BM Within CD8+ CD56+CD8+ CD57+CD8+ HLADR+CD8+ CD38+CD8+ Vβ skewing PB No skewing (n=31) Skewing (n=16) -0.7 (-1.6-2.3) -0.2 (-1.3-3.7) -0.8 (-1.4-6.6) 0.3 (-6.3-3.3) 0.05 (-0.8-4) 0.35 (-1.3-4.1) -0.3 (-1.1-2.5) 0.35 (-2-3.2) P 0.012 0.024 0.044 NS No skewing (n=32) Skewing (n=22) -0.7 (-1.7-2.3) -0.5 (-1.3-2.3) -0.7 (-1.4-6.6) 0.15 (-6.3-3.3) -0.05 (-1.1-4) 0.6 (-0.8-6.4) -0.35 (-1.2-2.5) 0.55 (-2-3.2) P 0.023 0.000 0.082 NS 7 Supplemental References 1. Baumann I, Niemeyer CM, Bennett JM, Shannon K. Childhood myelodysplastic syndromes. In: Swerdlow SH, Campo E, Harris NL, Jaffe ES, Pileri SA, Stein H, et al., eds. WHO Classification of Tumours of Haematopoietic and Lymphoid Tissues. Lyon: IARC; 2008:104-107. 2. Langerak AW, van Den Beemd R, Wolvers-Tettero IL, Boor PP, van Lochem EG, Hooijkaas H, et al. Molecular and flow cytometric analysis of the Vbeta repertoire for clonality assessment in mature TCRalphabeta T-cell proliferations. Blood. 2001;98(1):165-173. 3. de Vries AC, Langerak AW, Verhaaf B, Niemeyer CM, Stary J, Schmiegelow K, et al. T-cell receptor Vbeta CDR3 oligoclonality frequently occurs in childhood refractory cytopenia (MDS-RC) and severe aplastic anemia. Leukemia. 2008;22(6):1170-1174. 4. Hamann D, Baars PA, Rep MH, Hooibrink B, Kerkhof-Garde SR, Klein MR, et al. Phenotypic and functional separation of memory and effector human CD8+ T cells. J Exp Med. 1997;186(9):1407-1418. 5. Comans-Bitter WM, de Groot R, van den Beemd R, Neijens HJ, Hop WC, Groeneveld K, et al. Immunophenotyping of blood lymphocytes in childhood. Reference values for lymphocyte subpopulations. J Pediatr. 1997;130(3):388-393. 8
