TPJ_2602_sm_supp
advertisement
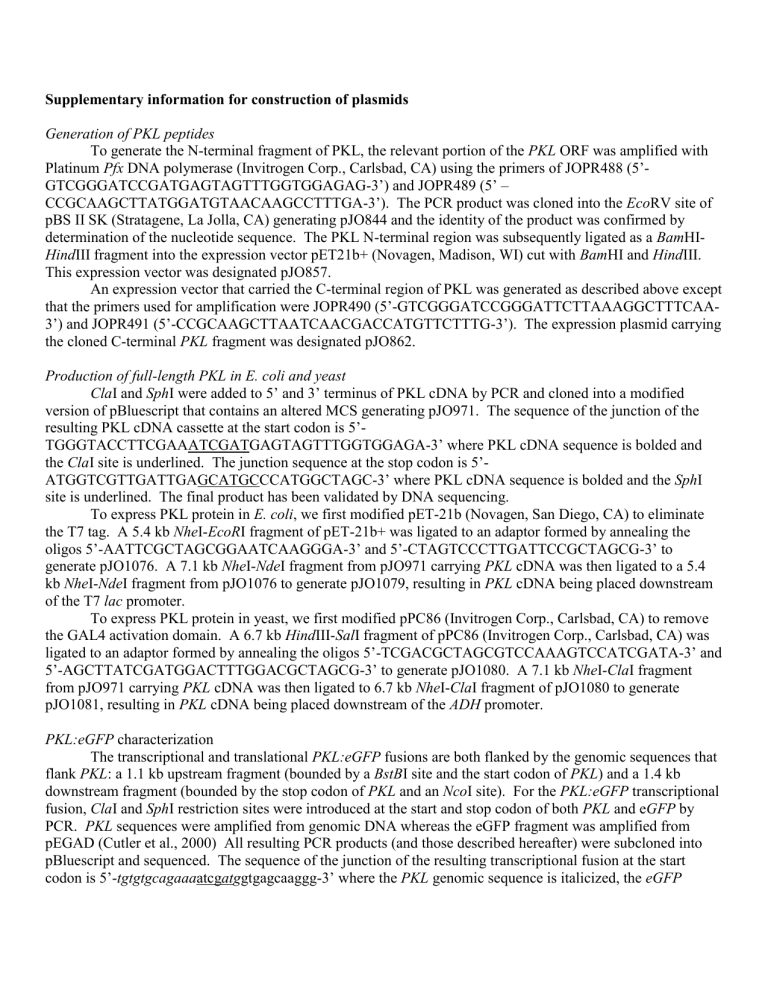
Supplementary information for construction of plasmids Generation of PKL peptides To generate the N-terminal fragment of PKL, the relevant portion of the PKL ORF was amplified with Platinum Pfx DNA polymerase (Invitrogen Corp., Carlsbad, CA) using the primers of JOPR488 (5’GTCGGGATCCGATGAGTAGTTTGGTGGAGAG-3’) and JOPR489 (5’ – CCGCAAGCTTATGGATGTAACAAGCCTTTGA-3’). The PCR product was cloned into the EcoRV site of pBS II SK (Stratagene, La Jolla, CA) generating pJO844 and the identity of the product was confirmed by determination of the nucleotide sequence. The PKL N-terminal region was subsequently ligated as a BamHIHindIII fragment into the expression vector pET21b+ (Novagen, Madison, WI) cut with BamHI and HindIII. This expression vector was designated pJO857. An expression vector that carried the C-terminal region of PKL was generated as described above except that the primers used for amplification were JOPR490 (5’-GTCGGGATCCGGGATTCTTAAAGGCTTTCAA3’) and JOPR491 (5’-CCGCAAGCTTAATCAACGACCATGTTCTTTG-3’). The expression plasmid carrying the cloned C-terminal PKL fragment was designated pJO862. Production of full-length PKL in E. coli and yeast ClaI and SphI were added to 5’ and 3’ terminus of PKL cDNA by PCR and cloned into a modified version of pBluescript that contains an altered MCS generating pJO971. The sequence of the junction of the resulting PKL cDNA cassette at the start codon is 5’TGGGTACCTTCGAAATCGATGAGTAGTTTGGTGGAGA-3’ where PKL cDNA sequence is bolded and the ClaI site is underlined. The junction sequence at the stop codon is 5’ATGGTCGTTGATTGAGCATGCCCATGGCTAGC-3’ where PKL cDNA sequence is bolded and the SphI site is underlined. The final product has been validated by DNA sequencing. To express PKL protein in E. coli, we first modified pET-21b (Novagen, San Diego, CA) to eliminate the T7 tag. A 5.4 kb NheI-EcoRI fragment of pET-21b+ was ligated to an adaptor formed by annealing the oligos 5’-AATTCGCTAGCGGAATCAAGGGA-3’ and 5’-CTAGTCCCTTGATTCCGCTAGCG-3’ to generate pJO1076. A 7.1 kb NheI-NdeI fragment from pJO971 carrying PKL cDNA was then ligated to a 5.4 kb NheI-NdeI fragment from pJO1076 to generate pJO1079, resulting in PKL cDNA being placed downstream of the T7 lac promoter. To express PKL protein in yeast, we first modified pPC86 (Invitrogen Corp., Carlsbad, CA) to remove the GAL4 activation domain. A 6.7 kb HindIII-SalI fragment of pPC86 (Invitrogen Corp., Carlsbad, CA) was ligated to an adaptor formed by annealing the oligos 5’-TCGACGCTAGCGTCCAAAGTCCATCGATA-3’ and 5’-AGCTTATCGATGGACTTTGGACGCTAGCG-3’ to generate pJO1080. A 7.1 kb NheI-ClaI fragment from pJO971 carrying PKL cDNA was then ligated to 6.7 kb NheI-ClaI fragment of pJO1080 to generate pJO1081, resulting in PKL cDNA being placed downstream of the ADH promoter. PKL:eGFP characterization The transcriptional and translational PKL:eGFP fusions are both flanked by the genomic sequences that flank PKL: a 1.1 kb upstream fragment (bounded by a BstBI site and the start codon of PKL) and a 1.4 kb downstream fragment (bounded by the stop codon of PKL and an NcoI site). For the PKL:eGFP transcriptional fusion, ClaI and SphI restriction sites were introduced at the start and stop codon of both PKL and eGFP by PCR. PKL sequences were amplified from genomic DNA whereas the eGFP fragment was amplified from pEGAD (Cutler et al., 2000) All resulting PCR products (and those described hereafter) were subcloned into pBluescript and sequenced. The sequence of the junction of the resulting transcriptional fusion at the start codon is 5’-tgtgtgcagaaaatcgatggtgagcaaggg-3’ where the PKL genomic sequence is italicized, the eGFP sequence is bolded, the ATG is italicized and bolded, and the ClaI site is underlined. The sequence of the junction of the resulting transcriptional fusion at the stop codon is 5’-cgagctgtacaagtagcatgctcaactggt-3’ where the eGFP sequence is bolded, the PKL genomic sequence is italicized, the termination codon is italicized and bolded, and the SphI site is underlined. For the PKL:eGFP translational fusion, the PKL genomic sequence between the start and the stop codon was replaced with full-length PKL cDNA by PCR. ClaI and SphI sites were introduced by PCR prior to the termination codon of PKL such that it is possible to generate translational fusions with ClaI-SphI fragments. The resulting vector ( containing 1.1 kb of PKL upstream sequence, PKL cDNA, ClaI, SphI, and 1.4 kb of PKL downstream sequence) is referred to as pJO981. A ClaI site and an (Ala)9 linker were introduced at the ATG of eGFP and an SphI site was introduced at the 3’ terminus by PCR. The ClaI-SphI fragment spanning the resulting eGFP product was then cloned into pJO981, generating pJO1027. The sequence of the resulting junction and the 3’ end of the PKL ORF is 5’- ggtcgttgatatcgat[gccgctgcggcagcggctgcggccgcttcg]atggtgagca-3’ where the PKL cDNA sequence is italicized, the eGFP sequence is bolded, the (Ala)9 linker sequence is bracketed, and the ClaI site is underlined. The sequence of the junction at the termination codon of the translational fusion is as described above for the transcriptional fusion. PKL:GR inducible lines PKL:GR is a C-terminal fusion of PKL with the ligand-binding domain of the rat glucocorticoid receptor (GR). Similar to the PKL:eGFP translational fusion described above, PKL:GR is derived from pJO981. A ClaI site and a small linker were introduced at the 5’ terminus of the ligand-binding domain of GR and an SphI site was introduced at the 3’ terminus by PCR amplification of pBI-GR (Lloyd et al., 1994). The ClaI-SphI fragment spanning the resulting GR product was then cloned into pJO981, generating pJO1002. The sequence of the resulting junction and the 3’ end of the PKL ORF is 5’- ggtcgttgatatcgat[gctctagaggttcct]gaagctcgaa-3’ where the PKL cDNA sequence is italicized, the GR sequence is bolded, the linker sequence is bracketed, and the ClaI site is underlined. The sequence of the junction of the resulting transcriptional fusion at the stop codon is 5’-tcatcaaaaatgagcatgctcaactggt-3’ where the GR sequence is bolded, the PKL genomic sequence is italicized, the termination codon is italicized and bolded, and the SphI site is underlined. Supplementary information for qRT-PCR: Oligonucleotide primer sequences and primer concentrations used for qRT-PCR are available in Table S2. Relative expression values of genes were calculated from critical threshold values as described in ABI User Bulletin #2, part # 4303859B available at http://docs.appliedbiosystems.com/search.taf?_UserReference=6E00E667F6CFB2C43DE24701. Table S2 lists the critical threshold values for Table 1 from the manuscript. Table S1. Relative transcript levels for Type I MADS-box transcription factors in pkl mutants. Transcript levels were determined for pkl and wild type plants at 50% radicle emergence (50% germination), in young seedlings (4-day-old seedlings) and in 21 day-old leaves (21-day-old rosette). 18s rRNA was used as a standardization control. Expression levels in pkl plants are normalized relative to wild-type plants. N/D indicates transcript not detected. AGI code At1g01530 At1g17310 At1g18750 At1g22130 At1g22590 At1g28450 At1g28460 At1g31140 At1g31630 At1g31640 At1g47760 At1g48150 At1g60880 At1g60920 At1g65300 At1g65330 At1g65360 At1g69540 At1g72350 At1g77950 At1g77980 At2g03060 At2g24840 At2g26320 At2g26880 At2g28700 At2g34440 At2g40210 At3g04100 At3g05860 At3g66656 At4g14530 At4g36590 At5g04640 At5g06500 At5g26580 At5g26630 At5g26650 At5g26950 At5g27130 At5g27960 At5g38620 At5g48670 At5g49420 At5g49490 At5g55690 At5g58890 At5g60440 At5g38620 At5g48670 At5g49420 At5g49490 At5g55690 At5g58890 At5g60440 50% germination WT pkl-1 1 2.20 1 0.51 1 0.08 1 1.50 1 0.52 N/D N/D 1 2.33 N/D N/D 1 0.78 N/D N/D 1 3.47 1 0.57 1 0.63 1 2.83 1 1.81 1 2.24 N/D N/D 1 1.19 1 0.60 1 0.88 N/D N/D 1 1.25 N/D N/D N/D N/D 1 1.56 N/D N/D 1 1.44 1 1.92 N/D N/D 1 3.66 1 37.53 N/D N/D N/D N/D N/D N/D N/D N/D 1 0.87 1 5.08 1 1.56 1 3.05 N/D N/D N/D N/D N/D N/D 1 1.64 1 2.08 N/D N/D N/D N/D N/D N/D 1 0.28 N/D N/D 1 1.64 1 2.08 N/D N/D N/D N/D N/D N/D 1 0.28 4-day- old seedlings WT pkl-1 1 1.49 1 0.69 1 1.22 1 4.43 1 0.45 1 4.35 1 1.19 1 1.02 1 0.54 1 1.59 1 2.21 1 1.94 1 0.38 1 0.27 1 40.04 1 161.27 N/D N/D 1 0.99 1 0.32 1 0.72 1 0.28 1 1.27 1 2.27 1 0.86 N/D N/D 1 17.15 1 0.73 1 1.85 N/D N/D 1 3.34 1 1.28 1 0.93 N/D N/D 1 0.92 N/D N/D 1 0.99 1 0.57 N/D N/D 1 0.92 1 1.63 N/D N/D N/D N/D 1 1.01 N/D N/D 1 2.13 1 3.30 1 0.82 1 0.35 N/D N/D 1 1.01 N/D N/D 1 2.13 1 3.30 1 0.82 1 0.35 21-day- old rosett e WT pkl-1 1 2.04 1 0.39 1 0.73 1 0.54 1 0.22 N/D N/D N/D N/D 1 0.24 N/D N/D 1 1.09 1 0.57 1 0.72 1 0.87 N/D N/D 1 21.41 1 184.82 1 0.83 1 0.78 N/D N/D N/D N/D N/D N/D 1 1.30 N/D N/D N/D N/D N/D N/D 1 3.15 1 2.09 N/D N/D N/D N/D N/D N/D N/D N/D N/D N/D N/D N/D N/D N/D N/D N/D 1 2.52 1 0.74 N/D N/D 1 2.10 1 0.19 N/D N/D N/D N/D 1 0.23 1 0.19 N/D N/D N/D N/D N/D N/D 1 0.41 N/D N/D 1 0.23 1 0.19 N/D N/D N/D N/D N/D N/D 1 0.41 Table S2. Primer information for qRT-PCR. Gene name PHE2 PHE1 18S LEC1 AGI code At1g01530 At1g17310 At1g18750 At1g22130 At1g22590 At1g28450 At1g28460 At1g31140 At1g31630 At1g31640 At1g47760 At1g48150 At1g60880 At1g60920 At1g65300 At1g65330 At1g65360 At1g69540 At1g72350 At1g77950 At1g77980 At2g03060 At2g24840 At2g26320 At2g26880 At2g28700 At2g34440 At2g40210 At3g04100 At3g05860 At3g66656 At4g14530 At4g36590 At5g04640 At5g06500 At5g26580 At5g26630 At5g26650 At5g26950 At5g27130 At5g27960 At5g38620 At5g48670 At5g49420 At5g49490 At5g55690 At5g58890 At5g60440 At1g21970 Oligonucleot ide Primer Sequences Forward primer sequence Reverse primer sequence TGATCAAAACGGAAACTCTACTTCTG GCTGGTGTGCGATTCATAACA GGTAACGATCGGACGGTTGA GGTTTCCATCCCATCACATTG AACTCTTGCCAATAGAATGTGCAA TTACCTCCCATCGCCATAGG TGCCAGCTCAGCAGAGTGATA GTCGGAGACTTCATGATCAACTTG CGGTCAGAGTGGCTTGCA TTCTCTACCGGAAGTTCGCTTAA TCAAGAAAATTGAAAAAGACGAAGAC AGAGAATGGAAAGCTCAATGATCA ACACTTTTGGCAGTCCATCCTT AGGCATCGCCGTTGAGAA CGATGTCCACCTTGGTCTCA TGCTGGTAGAGTTGGAGCAGAA CAGTGGTGTGGCCGTCAA CCGGCCTCTCCATAAACATG ACAGTCCGTTCGAGAATCCAA GAACTCCGAAATCACCTCTTGAA CGAAAGGAAAGCGACGTTTT CGCGAGTTCATCAGCCTTCT TTGAAATTGAGAAACGCATGACTAAA AGTGTGGGACGGCGTTTG GCAATCTTAGCGGCTCCTATGA CGACAGAGGAATGACCGAAAG GGCAGTCGATGCGGTTTC TGCTCTTCACGGCATCATCTA GATGACGAAGAAACTAACCGAGCTA GGGATCGAGTTGAACGGACTATAG CATCTGTCCCAATCGGTTTTG TGGAATTGAACCGGCTCTTG TTCAAATGCTCAACAAATCCTACAC GCCCGCGACTGCTTATTC GGGAAAGGCTTCAATTTGCA GGAGAGAGTTGAGCAAACTTAGCA CCCGAAGGCAAGTGACGTT CTTAATTCTGCCGCTTTTTTGAA TCTTTTCCGGTCAAACAAGGA CTCTTTCTTGATCAGGAAGATTGATG TGGGTGGGCCTTTTGGA CTTCGTTAGGCCCATTTTCAGT GTCGAGTGCTCAGCGAGTTCT TCAGGAGATTTCCCTGTTCCA TCGCTACGTGTCTCGAAACAA TGCAGGGCTTCCTTGCA CCCACCGAGAAGCCTACAGTT GCATGCAAAACCTCTCAAGGA AAGAAGTTTGATTTCATGCAGCAT CGACTTGCACCTCGAATGG CTGGAAACATGGCAACAACTGTA AGGAGGAACTCCCTTCAGCAA GGACATGAACACACGACAGGTT AACTCGCTCGCCTTCTTGAA CCCCGATAAGGTTGGACCAT CGAAAAATTCGTCTAGGAGACCAT CAGACCCCTCGTCGAAGCT TCGAGCGCCTCCATTTTTT CGTTCTCTGCGGAATCGAA GCCAGACTTCAGGGTTTGAGTT GAGCGAGCTTGCGACTCTGT CGGTTTGTTTCCTGGAGAAAAG TCGGAGGATTCGGAGGAGTT CCAATTCCTTCAGATCTCTCAACA CACATTAAGTGGTGCAGAGATTCTG TGGATGGCCAAAAGAAAACAC TCTCTCCGATGCACAAATTGC GCCAAAGGTGTAGAAAGAAACGTT GCCCTGAGGGCTTCGAAT CTTCCAGTTTCCATCATGTTTAACC TGGCCGATACGACTCATTTTC AGCCTGGTATTGAACCTGATTCA TGTCGTCAACAGTCCGTACGA CCTGGTTCGCAGCCTCTCT TGAATCCGATGGTGGAACAA TAGCAGTTTCCGTCCACGAAA TTTTCCTCCTCAGATGCAGACA GATTCCATGGCGCAAACTG AGAGCAACGAGCCGTGACTT GAGATCGGCGGCTTTGG TTCTTGCGGGCGATATGAC CTGGGAGCAGTTACCGCATT TGTTCACGGAACTCAAGATCAAA GATTTTCAGGGATGCAACAAACT CCAACATCAGATCCATGACGAA CAGGGATGATGCTGCTTGAGT GACGAGGGAGGACGTTGGTA CGTCGTTCCACCAAAAACCT CGAGATTGAGAGATTATGGCTTTCA CCACAGCGACGGTTTTTGTT CCTCAAATACTGCGGAAGTGTCT AGCTTTGCCCGTTCGCTAT AAACCAACGTGGAGACTTTCGT TCACGCTTCACTCTCTTTTTAGTCA GACAAAAGCCCTTGGGAATTG AACCCCTCGAGTTGAGATAACG GGTCTGTGATGCCCTTAGATGTT GGCAAGGTGTGAACTCGTTGA AAGCCGGCATTCCGTTAAT GGTCGTCGGGTCAAGATGAA primer number (JOPR####) Forward Reverse 2595 2596 2597 2598 2599 2600 3127 3128 2603 2604 3129 3130 2607 2608 2609 2610 2611 2612 2613 2614 2615 2616 3131 3132 2619 2620 2621 2622 3133 3134 2623 2624 3135 3136 2629 2630 2631 2632 2633 2634 2635 2636 2637 2638 2639 2640 2641 2642 2643 2644 2645 2646 2647 2648 2649 2650 2651 2652 2653 2654 2655 2656 2657 2658 2659 2660 2661 2662 2663 2664 2665 2666 2667 2668 2669 2670 2671 2672 2673 2674 2675 2676 2677 2678 2679 2680 2681 2682 2683 2684 2685 2686 2687 2688 2689 2690 997 998 868 869 Concentrations used (nM) Forward Reverse 900 900 900 900 900 900 900 900 900 900 900 900 900 900 900 900 900 900 900 900 900 900 900 900 900 900 900 900 50 300 900 900 900 900 900 900 900 900 900 900 900 900 900 900 900 900 900 900 300 300 900 900 900 900 300 900 900 900 900 900 300 300 300 300 900 900 900 900 900 900 900 900 900 900 900 900 900 900 300 900 900 900 300 300 900 900 900 900 900 900 900 900 900 900 900 900 300 900 300 50 Table S3. Critical threshold values for Tables 1, 2, and S1. “AGI Code” provides the AGI number for the analyzed gene. ”Sample” describes the sample collected. Sample codes: W=wt, P=pkl, G=germination, S=4d seedling, R=21d rosette. “Average CT” is average critical threshold of three measurements, and “STDEV” is the standard deviation associated with the average critical threshold. 18S was used as a control. “GOI” indicates values for gene of interest (designated by AGI code in first column). N/D indicates not detected. AGI code At1g01530 At1g17310 At1g18750 At1g22130 At1g22590 At1g28450 At1g28460 At1g31140 At1g31630 At1g31640 At1g47760 At1g48150 At1g60880 At1g60920 At1g65300 At1g65330 At1g65360 At1g69540 At1g72350 At1g77950 At1g77980 At2g03060 At2g24840 At2g26320 At2g26880 At2g28700 At2g34440 At2g40210 At3g04100 At3g05860 At3g66656 At4g14530 At4g36590 At5g04640 At5g06500 At5g26580 At5g26630 At5g26650 At5g26950 At5g27130 At5g27960 At5g38620 At5g48670 At5g49420 At5g49490 At5g55690 At5g58890 At5g60440 Sample WG1 WG2 WG3 WG4 WG5 WG6 WG7 WG8 WG9 WG10 WG11 WG12 WG13 WG14 WG15 WG16 WG17 WG18 WG19 WG20 WG21 WG22 WG23 WG24 WG25 WG26 WG27 WG28 WG29 WG30 WG31 WG32 WG33 WG34 WG35 WG36 WG37 WG38 WG39 WG40 WG41 WG42 WG43 WG44 WG45 WG46 WG47 WG48 18S Avg CT STDEV 7.18 0.27 6.83 0.12 9.24 0.05 8.15 0.05 7.36 0.07 6.38 0.08 7.36 0.07 6.82 0.16 6.82 0.16 7.18 0.08 7.68 0.10 7.68 0.10 6.82 0.16 7.30 0.09 7.50 0.17 7.18 0.08 6.24 0.16 7.97 0.16 7.97 0.16 6.59 0.17 6.59 0.17 8.19 0.08 8.19 0.08 8.19 0.08 8.26 0.11 8.17 0.08 7.66 0.02 7.18 0.27 7.43 0.46 6.66 0.08 7.66 0.02 7.50 0.17 9.17 0.07 7.43 0.46 7.84 0.16 7.05 0.40 6.15 0.13 7.43 0.46 6.71 0.18 7.43 0.46 6.71 0.18 6.71 0.18 6.71 0.18 7.67 0.43 7.67 0.43 6.48 0.12 7.56 0.06 7.43 0.14 GOI Avg CT STDEV 35.02 0.08 33.65 0.20 31.35 0.58 37.61 0.32 28.16 0.07 34.92 N/D 37.95 0.21 35.60 N/D 35.52 N/D N/D N/D 26.81 0.14 33.70 0.48 34.02 0.01 35.84 0.65 37.09 N/D 36.09 0.40 39.65 N/D 32.89 0.36 37.73 2.18 28.80 0.15 N/D N/D 27.52 0.08 N/D N/D 38.92 N/D 35.79 0.67 N/D N/D 33.44 0.30 36.02 0.37 N/D N/D 34.20 0.45 38.34 1.00 35.66 0.22 36.84 0.60 35.87 0.26 38.24 1.44 37.48 0.43 37.39 1.40 36.67 0.25 34.81 0.41 39.47 N/D 35.44 0.25 36.59 N/D 32.76 0.26 36.85 1.03 35.99 0.22 34.80 0.33 35.98 N/D 34.07 0.15 Sample PG1 PG2 PG3 PG4 PG5 PG6 PG7 PG8 PG9 PG10 PG11 PG12 PG13 PG14 PG15 PG16 PG17 PG18 PG19 PG20 PG21 PG22 PG23 PG24 PG25 PG26 PG27 PG28 PG29 PG30 PG31 PG32 PG33 PG34 PG35 PG36 PG37 PG38 PG39 PG40 PG41 PG42 PG43 PG44 PG45 PG46 PG47 PG48 Avg CT 7.82 6.91 9.29 8.21 7.43 6.45 7.43 6.98 6.98 6.85 7.90 7.90 6.98 7.46 8.06 6.85 6.40 8.14 8.14 6.80 6.80 8.25 8.25 8.25 8.78 8.58 7.98 7.82 8.19 7.05 7.98 8.06 9.47 8.19 8.34 7.22 6.38 8.19 6.71 8.19 6.71 6.71 6.71 7.77 7.77 6.86 7.93 7.86 18S STDEV 0.32 0.09 0.05 0.05 0.06 0.08 0.06 0.16 0.16 0.01 0.16 0.16 0.16 0.15 0.06 0.01 0.12 0.04 0.04 0.13 0.13 0.10 0.10 0.10 0.41 0.54 0.21 0.32 0.20 0.17 0.21 0.06 0.13 0.20 0.37 0.71 0.11 0.20 0.06 0.20 0.06 0.06 0.06 0.75 0.75 0.21 0.28 0.20 GOI Avg CT STDEV 34.52 0.41 34.70 0.46 34.97 0.62 37.08 0.33 29.15 0.12 34.14 N/D 36.79 0.91 38.81 N/D 36.03 N/D N/D N/D 25.23 0.26 34.73 0.57 34.84 1.01 34.50 0.62 36.80 0.12 34.60 0.56 38.39 N/D 32.80 0.14 38.64 1.41 29.20 0.15 36.58 1.19 27.25 0.13 38.12 0.10 N/D N/D 35.66 0.00 37.85 N/D 33.24 0.51 35.72 0.43 38.13 N/D 32.73 0.62 33.44 0.50 36.00 N/D 37.52 N/D 36.76 N/D 36.04 0.14 37.86 1.19 35.28 0.19 36.79 0.79 33.21 0.18 36.14 0.47 35.48 N/D 35.94 N/D 32.06 0.35 35.89 0.64 N/D N/D 35.04 N/D 36.51 0.87 36.34 0.92 Table S3. (Cont’d) AGI code At1g01530 At1g17310 At1g18750 At1g22130 At1g22590 At1g28450 At1g28460 At1g31140 At1g31630 At1g31640 At1g47760 At1g48150 At1g60880 At1g60920 At1g65300 At1g65330 At1g65360 At1g69540 At1g72350 At1g77950 At1g77980 At2g03060 At2g24840 At2g26320 At2g26880 At2g28700 At2g34440 At2g40210 At3g04100 At3g05860 At3g66656 At4g14530 At4g36590 At5g04640 At5g06500 At5g26580 At5g26630 At5g26650 At5g26950 At5g27130 At5g27960 At5g38620 At5g48670 At5g49420 At5g49490 At5g55690 At5g58890 At5g60440 Sample WS1 WS2 WS3 WS4 WS5 WS6 WS7 WS8 WS9 WS10 WS11 WS12 WS13 WS14 WS15 WS16 WS17 WS18 WS19 WS20 WS21 WS22 WS23 WS24 WS25 WS26 WS27 WS28 WS29 WS30 WS31 WS32 WS33 WS34 WS35 WS36 WS37 WS38 WS39 WS40 WS41 WS42 WS43 WS44 WS45 WS46 WS47 WS48 18S Avg CT STDEV 7.23 0.07 6.44 0.08 9.60 0.10 7.39 0.21 6.44 0.08 7.59 0.14 6.44 0.08 7.33 0.11 6.44 0.08 7.39 0.21 6.44 0.08 7.33 0.11 7.33 0.11 6.44 0.08 7.39 0.21 6.49 0.12 6.49 0.12 6.49 0.12 7.58 0.06 7.03 0.03 6.44 0.08 6.54 0.09 6.13 0.09 5.61 0.19 7.59 0.05 6.54 0.09 8.09 0.03 7.59 0.05 6.45 0.01 6.44 0.22 7.59 0.05 7.18 0.12 7.06 0.02 6.44 0.22 6.44 0.22 7.02 0.06 7.02 0.06 7.02 0.06 6.45 0.01 8.08 0.01 7.02 0.06 7.02 0.06 6.45 0.01 7.02 0.06 6.45 0.01 7.39 0.21 5.49 0.04 6.45 0.01 GOI Avg CT STDEV 32.86 0.10 30.99 0.25 31.81 0.28 37.12 0.28 24.15 0.01 36.58 0.17 36.16 0.93 33.86 0.62 32.84 0.54 35.84 0.64 25.34 0.03 33.47 0.79 34.25 0.33 32.90 0.38 35.60 0.59 31.41 0.14 35.27 0.08 31.74 0.16 34.93 0.40 30.38 0.09 35.30 0.33 25.46 0.07 36.72 1.52 36.03 0.27 N/D N/D 34.47 1.05 32.43 0.36 37.67 0.76 39.57 0.03 29.61 0.27 33.57 0.31 35.16 0.14 33.89 0.66 38.80 0.28 37.24 N/D 36.61 0.29 32.91 0.48 N/D N/D 33.68 0.55 33.97 0.24 35.44 N/D 37.27 N/D 30.02 0.15 34.06 0.23 36.71 0.98 36.86 0.99 33.86 0.45 30.98 0.23 Sample PS1 PS2 PS3 PS4 PS5 PS6 PS7 PS8 PS9 PS10 PS11 PS12 PS13 PS14 PS15 PS16 PS17 PS18 PS19 PS20 PS21 PS22 PS23 PS24 PS25 PS26 PS27 PS28 PS29 PS30 PS31 PS32 PS33 PS34 PS35 PS36 PS37 PS38 PS39 PS40 PS41 PS42 PS43 PS44 PS45 PS46 PS47 PS48 Avg CT 7.36 7.21 9.70 8.01 7.21 7.74 7.21 7.69 7.21 8.01 7.21 7.69 7.69 7.21 8.01 6.69 6.69 6.69 7.68 7.75 7.21 6.71 6.87 6.33 7.85 6.71 8.09 7.85 7.21 6.79 7.85 7.41 7.72 6.79 6.79 7.37 7.37 7.37 7.18 8.77 7.37 7.37 7.18 7.37 7.18 8.01 6.29 7.18 18S STDEV 0.07 0.07 0.10 0.07 0.07 0.18 0.07 0.22 0.07 0.07 0.07 0.22 0.22 0.07 0.07 0.36 0.36 0.36 0.42 0.07 0.07 0.08 0.14 0.19 0.23 0.08 0.41 0.23 0.07 0.41 0.23 0.11 0.01 0.41 0.41 0.12 0.12 0.12 0.03 0.01 0.12 0.12 0.03 0.12 0.03 0.07 0.09 0.03 GOI Avg CT STDEV 32.41 0.36 32.30 0.05 31.63 0.23 35.59 0.16 26.07 0.11 34.60 0.11 36.69 0.14 34.19 0.54 34.51 0.76 35.80 0.74 24.97 0.04 32.87 0.42 36.00 0.07 35.57 0.25 30.90 0.34 24.27 0.02 34.48 N/D 31.94 0.62 36.65 0.87 31.58 0.16 37.89 0.47 25.29 0.04 36.28 1.03 36.97 0.08 N/D N/D 30.54 0.07 32.88 0.24 37.05 0.04 36.73 N/D 28.23 0.26 33.48 0.22 35.49 2.21 38.52 0.47 39.27 0.54 34.81 0.47 36.98 0.26 34.07 0.69 N/D N/D 34.52 0.38 33.95 0.60 35.80 N/D N/D N/D 30.73 0.31 36.76 2.26 36.35 0.49 35.76 0.42 34.95 0.25 33.23 0.11 Table S3. (Cont’d) AGI code At1g01530 At1g17310 At1g18750 At1g22130 At1g22590 At1g28450 At1g28460 At1g31140 At1g31630 At1g31640 At1g47760 At1g48150 At1g60880 At1g60920 At1g65300 At1g65330 At1g65360 At1g69540 At1g72350 At1g77950 At1g77980 At2g03060 At2g24840 At2g26320 At2g26880 At2g28700 At2g34440 At2g40210 At3g04100 At3g05860 At3g66656 At4g14530 At4g36590 At5g04640 At5g06500 At5g26580 At5g26630 At5g26650 At5g26950 At5g27130 At5g27960 At5g38620 At5g48670 At5g49420 At5g49490 At5g55690 At5g58890 At5g60440 Sample WR1 WR2 WR3 WR4 WR5 WR6 WR7 WR8 WR9 WR10 WR11 WR12 WR13 WR14 WR15 WR16 WR17 WR18 WR19 WR20 WR21 WR22 WR23 WR24 WR25 WR26 WR27 WR28 WR29 WR30 WR31 WR32 WR33 WR34 WR35 WR36 WR37 WR38 WR39 WR40 WR41 WR42 WR43 WR44 WR45 WR46 WR47 WR48 18S Avg CT STDEV 7.25 0.20 7.25 0.20 7.25 0.20 7.25 0.20 7.25 0.20 7.25 0.20 7.04 0.21 7.04 0.21 7.04 0.21 7.04 0.21 7.04 0.21 7.04 0.21 7.04 0.21 7.04 0.21 7.04 0.21 7.04 0.21 7.04 0.21 7.04 0.21 7.04 0.21 7.04 0.21 7.04 0.21 6.82 0.43 6.82 0.43 6.82 0.43 8.61 0.43 6.82 0.43 6.82 0.43 6.82 0.43 6.82 0.43 6.82 0.43 6.82 0.43 6.82 0.43 8.61 0.43 6.82 0.43 6.82 0.43 6.82 0.43 7.10 0.60 7.10 0.60 7.10 0.60 7.10 0.60 7.10 0.60 7.10 0.60 7.10 0.60 7.10 0.60 7.10 0.60 7.10 0.60 7.10 0.60 7.10 0.60 GOI Avg CT STDEV 30.51 0.24 34.08 0.01 14.28 0.13 33.96 0.31 26.09 0.24 35.09 0.01 37.21 3.71 34.80 0.73 36.48 N/D 37.54 1.59 28.36 0.43 32.00 0.45 36.56 1.54 35.92 0.24 37.14 0.12 29.78 0.15 29.47 0.23 31.97 0.57 36.81 1.73 35.42 N/D 35.16 N/D 26.90 0.46 36.25 N/D N/D N/D 36.97 N/D 35.52 0.38 32.21 0.37 37.33 N/D 35.06 0.86 37.80 0.47 34.84 N/D 34.60 1.08 36.33 0.08 N/D N/D 37.15 N/D 36.88 0.29 31.92 0.18 37.82 N/D 35.39 0.17 34.95 0.18 35.41 0.06 37.27 N/D 32.38 0.35 35.84 0.80 39.63 0.26 34.58 0.66 35.43 0.05 30.33 0.38 Sample PR1 PR2 PR3 PR4 PR5 PR6 PR7 PR8 PR9 PR10 PR11 PR12 PR13 PR14 PR15 PR16 PR17 PR18 PR19 PR20 PR21 PR22 PR23 PR24 PR25 PR26 PR27 PR28 PR29 PR30 PR31 PR32 PR33 PR34 PR35 PR36 PR37 PR38 PR39 PR40 PR41 PR42 PR43 PR44 PR45 PR46 PR47 PR48 18S Avg CT STDEV 7.38 0.22 7.38 0.22 7.38 0.22 7.38 0.22 7.38 0.22 7.38 0.22 7.29 0.20 7.29 0.20 7.29 0.20 7.29 0.20 7.29 0.20 7.29 0.20 7.29 0.20 7.29 0.20 7.29 0.20 7.29 0.20 7.29 0.20 7.29 0.20 7.29 0.20 7.29 0.20 7.29 0.20 7.13 0.04 7.13 0.04 7.13 0.04 8.96 0.07 7.13 0.04 7.13 0.04 7.13 0.04 7.13 0.04 7.13 0.04 7.13 0.04 7.13 0.04 8.96 0.07 7.13 0.04 7.13 0.04 7.13 0.04 7.13 0.33 7.13 0.33 7.13 0.33 7.13 0.33 7.13 0.33 7.13 0.33 7.13 0.33 7.13 0.33 7.13 0.33 7.13 0.33 7.13 0.33 7.13 0.33 GOI Avg CT STDEV 29.61 0.14 35.58 0.14 14.86 1.79 34.98 0.46 28.37 0.11 34.98 N/D 34.56 N/D 37.09 2.60 38.48 N/D 37.66 0.99 29.42 0.11 32.72 0.27 37.00 2.22 39.03 N/D 32.97 0.21 22.49 0.13 29.98 0.11 32.57 0.32 N/D N/D N/D N/D N/D N/D 26.85 0.12 37.30 0.71 N/D N/D 37.74 N/D 34.18 0.35 31.46 0.01 35.26 N/D 34.95 N/D 35.37 0.21 35.38 N/D 33.30 N/D 37.06 N/D N/D N/D N/D N/D 35.86 0.33 32.38 0.68 N/D N/D 34.35 0.04 37.37 0.78 N/D N/D 36.37 0.53 34.54 0.30 38.24 1.06 N/D N/D N/D N/D 35.50 N/D 31.65 0.47 Table S4. Critical threshold values for Figure 6A. “AGI Code” provides the AGI number for the analyzed gene. “Average CT” is average critical threshold of three measurements, and “STDEV CT” is the standard deviation associated with the average critical threshold. “Genotype” indicates the type of plant collected, whereas ”Tissue” describes the sample collected. “Growth Conditions” indicates the presence or absence of Dex. 18S was used as a control. Gene 18S 18S 18S 18S PHE1 PHE1 PHE1 PHE1 AGI code At1g65330 At1g65330 At1g65330 At1g65330 Average CT 8.39 8.02 8.05 8.05 23.61 23.41 24.79 23.11 STDEV CT 0.30 0.02 0.02 0.01 0.18 0.03 0.24 0.08 Genotype pkl-1 pkl-1 PKL::GR PKL::GR pkl-1 pkl-1 PKL::GR PKL::GR Tissue 21day seedlings 21day seedlings 21day seedlings 21day seedlings 21day seedlings 21day seedlings 21day seedlings 21day seedlings Growth Condit ions Dex no Dex Dex no Dex Dex no Dex Dex no Dex Table S5. Critical threshold values for Figures 6B and 6C. “AGI Code” provides the AGI number for the analyzed gene. “Average CT” is average critical threshold of three measurements, and “STDEV CT” is the standard deviation associated with the average critical threshold. “Genotype” indicates the type of plant collected, whereas ”Tissue” describes the sample collected. “Growth Conditions” indicates Dex regimen. 18S was used as a control. Gene 18S 18S 18S 18S 18S 18S 18S 18S 18S 18S 18S 18S 18S 18S 18S 18S 18S 18S 18S 18S 18S 18S 18S 18S PHE1 PHE1 PHE1 PHE1 PHE1 PHE1 PHE1 PHE1 PHE1 PHE1 PHE1 PHE1 PHE1 PHE1 PHE1 PHE1 PHE1 PHE1 PHE1 PHE1 PHE1 PHE1 PHE1 PHE1 AGI code At1g65330 At1g65330 At1g65330 At1g65330 At1g65330 At1g65330 At1g65330 At1g65330 At1g65330 At1g65330 At1g65330 At1g65330 At1g65330 At1g65330 At1g65330 At1g65330 At1g65330 At1g65330 At1g65330 At1g65330 At1g65330 At1g65330 At1g65330 At1g65330 Average CT 10.09 10.08 10.13 9.91 10.39 10.04 10.29 10.09 9.24 8.60 8.46 8.73 10.27 9.87 10.16 10.34 10.21 10.21 10.19 10.04 8.62 8.88 9.35 9.31 27.99 27.67 27.91 28.35 27.14 27.05 27.65 27.80 25.34 25.19 25.68 25.71 30.61 30.21 28.45 28.83 29.13 28.43 27.16 28.59 27.09 25.81 26.60 28.85 STDEV CT 0.22 0.01 0.01 0.05 0.18 0.05 0.09 0.07 0.21 0.04 0.02 0.04 0.23 0.01 0.04 0.15 0.23 0.06 0.02 0.10 0.22 0.07 0.03 0.14 0.08 0.06 0.13 0.14 0.13 0.16 0.13 0.18 0.07 0.02 0.18 0.14 0.17 0.13 0.13 0.15 0.08 0.26 0.06 0.12 0.06 0.15 0.10 0.25 Genotype pkl- 1 pkl- 1 pkl- 1 pkl- 1 pkl- 1 pkl- 1 pkl- 1 pkl- 1 pkl- 1 pkl- 1 pkl- 1 pkl- 1 PKL:GR PKL:GR PKL:GR PKL:GR PKL:GR PKL:GR PKL:GR PKL:GR PKL:GR PKL:GR PKL:GR PKL:GR pkl- 1 pkl- 1 pkl- 1 pkl- 1 pkl- 1 pkl- 1 pkl- 1 pkl- 1 pkl- 1 pkl- 1 pkl- 1 pkl- 1 PKL:GR PKL:GR PKL:GR PKL:GR PKL:GR PKL:GR PKL:GR PKL:GR PKL:GR PKL:GR PKL:GR PKL:GR Tissue 10.5 day seedlings 10.5 day seedlings 10.5 day seedlings 10.5 day seedlings 11 day seelings 11 day seelings 11 day seelings 11 day seelings 13 day seedlings 13 day seedlings 13 day seedlings 13 day seedlings 10.5 day seedlings 10.5 day seedlings 10.5 day seedlings 10.5 day seedlings 11 day seelings 11 day seelings 11 day seelings 11 day seelings 13 day seedlings 13 day seedlings 13 day seedlings 13 day seedlings 10.5 day seedlings 10.5 day seedlings 10.5 day seedlings 10.5 day seedlings 11 day seelings 11 day seelings 11 day seelings 11 day seelings 13 day seedlings 13 day seedlings 13 day seedlings 13 day seedlings 10.5 day seedlings 10.5 day seedlings 10.5 day seedlings 10.5 day seedlings 11 day seelings 11 day seelings 11 day seelings 11 day seelings 13 day seedlings 13 day seedlings 13 day seedlings 13 day seedlings 10 10 10 10 10 10 10 10 10 10 10 10 10 10 10 10 10 10 10 10 10 10 10 10 10 10 10 10 10 10 10 10 10 10 10 10 10 10 10 10 10 10 10 10 10 10 10 10 days days days days days days days days days days days days days days days days days days days days days days days days days days days days days days days days days days days days days days days days days days days days days days days days Growth Conditions on Dex5 t o 0.5 day on Dex5 on Dex5 t o 0.5 day on no Dex on no Dex to 0.5 day on no Dex on no Dex to 0.5 day on Dex5 on Dex5 t o 1 day on Dex5 on Dex5 t o 1 day on no Dex on no Dex to 1 day on no Dex on no Dex to 1 day on Dex5 on Dex5 t o 3 day on Dex5 on Dex5 t o 3 day on no Dex on no Dex to 3 day on no Dex on no Dex to 3 day on Dex5 on Dex5 t o 0.5 day on Dex5 on Dex5 t o 0.5 day on no Dex on no Dex to 0.5 day on no Dex on no Dex to 0.5 day on Dex5 on Dex5 t o 1 day on Dex5 on Dex5 t o 1 day on no Dex on no Dex to 1 day on no Dex on no Dex to 1 day on Dex5 on Dex5 t o 3 day on Dex5 on Dex5 t o 3 day on no Dex on no Dex to 3 day on no Dex on no Dex to 3 day on Dex5 on Dex5 t o 0.5 day on Dex5 on Dex5 t o 0.5 day on no Dex on no Dex to 0.5 day on no Dex on no Dex to 0.5 day on Dex5 on Dex5 t o 1 day on Dex5 on Dex5 t o 1 day on no Dex on no Dex to 1 day on no Dex on no Dex to 1 day on Dex5 on Dex5 t o 3 day on Dex5 on Dex5 t o 3 day on no Dex on no Dex to 3 day on no Dex on no Dex to 3 day on Dex5 on Dex5 t o 0.5 day on Dex5 on Dex5 t o 0.5 day on no Dex on no Dex to 0.5 day on no Dex on no Dex to 0.5 day on Dex5 on Dex5 t o 1 day on Dex5 on Dex5 t o 1 day on no Dex on no Dex to 1 day on no Dex on no Dex to 1 day on Dex5 on Dex5 t o 3 day on Dex5 on Dex5 t o 3 day on no Dex on no Dex to 3 day on no Dex on no Dex to 3 day on Dex5 Table S6. Critical threshold values for Figure 7A. “AGI Code” provides the AGI number for the analyzed gene. “Average CT” is average critical threshold of three measurements, and “STDEV CT” is the standard deviation associated with the average critical threshold. “Genotype” indicates the type of plant collected, whereas ”Tissue” describes the sample collected. “Growth Conditions” indicates absence or presence of Dex. 18S was used as a control. Data are presented separately as the samples were analyzed on two separate plates. Gene 18S 18S 18S 18S LEC1 LEC1 LEC1 LEC1 Gene 18S 18S 18S 18S PHE1 PHE1 PHE1 PHE1 AGI code At1g21970 At1g21970 At1g21970 At1g21970 AGI code At1g65330 At1g65330 At1g65330 At1g65330 Average CT 6.52 6.58 6.58 6.59 27.88 28.56 28.64 31.09 Average CT 8.05 8.21 8.23 8.70 31.38 31.15 32.29 33.28 STDEV CT 0.19 0.02 0.11 0.07 0.22 0.16 0.11 0.13 STDEV CT 0.04 0.08 0.18 0.23 0.27 0.08 0.21 0.21 Genotype pkl-1 pkl-1 PKL::GR PKL::GR pkl-1 pkl-1 PKL::GR PKL::GR Genotype pkl-1 pkl-1 PKL::GR PKL::GR pkl-1 pkl-1 PKL::GR PKL::GR 50% 50% 50% 50% 50% 50% 50% 50% 50% 50% 50% 50% 50% 50% 50% 50% Tissue germination germination germination germination germination germination germination germination Tissue germination germination germination germination germination germination germination germination Growth Condit ions no Dex Dex no Dex Dex no Dex Dex no Dex Dex Growth Condit ions no Dex Dex no Dex Dex no Dex Dex no Dex Dex Table S7. Critical threshold values for Figure 7B. “AGI Code” provides the AGI number for the analyzed gene. “Average CT” is average critical threshold of three measurements, and “STDEV CT” is the standard deviation associated with the average critical threshold. “Genotype” indicates the type of plant collected, whereas ”Tissue” describes the sample collected. “Growth Conditions” indicates absence or presence of Dex. 18S was used as a control. Data are presented separately as the samples were analyzed on two separate plates. Gene 18S 18S 18S 18S LEC1 LEC1 LEC1 LEC1 PHE1 PHE1 PHE1 PHE1 AGI code At1g21970 At1g21970 At1g21970 At1g21970 At1g65330 At1g65330 At1g65330 At1g65330 Average CT 6.56 6.78 6.75 6.81 27.38 27.63 29.69 30.31 25.25 25.53 28.57 27.05 STDEV CT 0.04 0.04 0.14 0.09 0.11 0.10 0.02 0.16 0.05 0.09 0.16 0.14 Genotype pkl- 1 pkl- 1 PKL::GR PKL::GR pkl- 1 pkl- 1 PKL::GR PKL::GR pkl- 1 pkl- 1 PKL::GR PKL::GR Tissue 75% germination 75% germination 75% germination 75% germination 75% germination 75% germination 75% germination 75% germination 75% germination 75% germination 75% germination 75% germination Growth Conditions no Dex Dex5 no Dex Dex5 no Dex Dex5 no Dex Dex5 no Dex Dex5 no Dex Dex5
