iii. contruction of the representation from ridges
advertisement
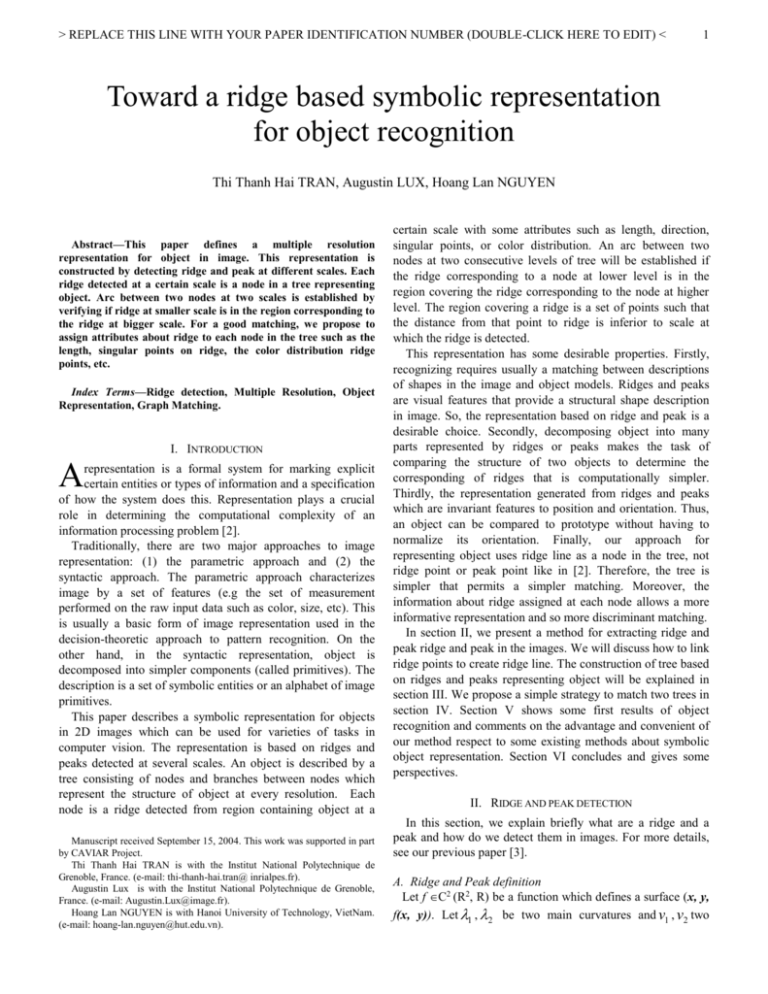
> REPLACE THIS LINE WITH YOUR PAPER IDENTIFICATION NUMBER (DOUBLE-CLICK HERE TO EDIT) <
1
Toward a ridge based symbolic representation
for object recognition
Thi Thanh Hai TRAN, Augustin LUX, Hoang Lan NGUYEN
Abstract—This paper defines a multiple resolution
representation for object in image. This representation is
constructed by detecting ridge and peak at different scales. Each
ridge detected at a certain scale is a node in a tree representing
object. Arc between two nodes at two scales is established by
verifying if ridge at smaller scale is in the region corresponding to
the ridge at bigger scale. For a good matching, we propose to
assign attributes about ridge to each node in the tree such as the
length, singular points on ridge, the color distribution ridge
points, etc.
Index Terms—Ridge detection, Multiple Resolution, Object
Representation, Graph Matching.
I. INTRODUCTION
A
representation is a formal system for marking explicit
certain entities or types of information and a specification
of how the system does this. Representation plays a crucial
role in determining the computational complexity of an
information processing problem [2].
Traditionally, there are two major approaches to image
representation: (1) the parametric approach and (2) the
syntactic approach. The parametric approach characterizes
image by a set of features (e.g the set of measurement
performed on the raw input data such as color, size, etc). This
is usually a basic form of image representation used in the
decision-theoretic approach to pattern recognition. On the
other hand, in the syntactic representation, object is
decomposed into simpler components (called primitives). The
description is a set of symbolic entities or an alphabet of image
primitives.
This paper describes a symbolic representation for objects
in 2D images which can be used for varieties of tasks in
computer vision. The representation is based on ridges and
peaks detected at several scales. An object is described by a
tree consisting of nodes and branches between nodes which
represent the structure of object at every resolution. Each
node is a ridge detected from region containing object at a
Manuscript received September 15, 2004. This work was supported in part
by CAVIAR Project.
Thi Thanh Hai TRAN is with the Institut National Polytechnique de
Grenoble, France. (e-mail: thi-thanh-hai.tran@ inrialpes.fr).
Augustin Lux is with the Institut National Polytechnique de Grenoble,
France. (e-mail: Augustin.Lux@image.fr).
Hoang Lan NGUYEN is with Hanoi University of Technology, VietNam.
(e-mail: hoang-lan.nguyen@hut.edu.vn).
certain scale with some attributes such as length, direction,
singular points, or color distribution. An arc between two
nodes at two consecutive levels of tree will be established if
the ridge corresponding to a node at lower level is in the
region covering the ridge corresponding to the node at higher
level. The region covering a ridge is a set of points such that
the distance from that point to ridge is inferior to scale at
which the ridge is detected.
This representation has some desirable properties. Firstly,
recognizing requires usually a matching between descriptions
of shapes in the image and object models. Ridges and peaks
are visual features that provide a structural shape description
in image. So, the representation based on ridge and peak is a
desirable choice. Secondly, decomposing object into many
parts represented by ridges or peaks makes the task of
comparing the structure of two objects to determine the
corresponding of ridges that is computationally simpler.
Thirdly, the representation generated from ridges and peaks
which are invariant features to position and orientation. Thus,
an object can be compared to prototype without having to
normalize its orientation. Finally, our approach for
representing object uses ridge line as a node in the tree, not
ridge point or peak point like in [2]. Therefore, the tree is
simpler that permits a simpler matching. Moreover, the
information about ridge assigned at each node allows a more
informative representation and so more discriminant matching.
In section II, we present a method for extracting ridge and
peak ridge and peak in the images. We will discuss how to link
ridge points to create ridge line. The construction of tree based
on ridges and peaks representing object will be explained in
section III. We propose a simple strategy to match two trees in
section IV. Section V shows some first results of object
recognition and comments on the advantage and convenient of
our method respect to some existing methods about symbolic
object representation. Section VI concludes and gives some
perspectives.
II. RIDGE AND PEAK DETECTION
In this section, we explain briefly what are a ridge and a
peak and how do we detect them in images. For more details,
see our previous paper [3].
A. Ridge and Peak definition
Let f C2 (R2, R) be a function which defines a surface (x, y,
f(x, y)). Let 1 , 2 be two main curvatures and v1 , v2 two
> REPLACE THIS LINE WITH YOUR PAPER IDENTIFICATION NUMBER (DOUBLE-CLICK HERE TO EDIT) <
corresponding main directions of the local surface associated
to a point M(x, y).
3
2
2
1
Ridge
0
0
1
Fig. 1. (a) An aerial image. (b) 3D representation of Gaussian of the
region bounded by red rectangle
We define a point M(x,y) a ridge point if the Laplacian at
this point is a local extremum in the direction corresponding to
the greatest curvature. In case where the Laplacian is a local
extremum in all directions, we have a peak. As the Laplacian
and the main directions are invariant to rotation and
translation, ridge and peak are too.
In image, the function f is frequently considered as intensity
function. Therefore, detecting ridge and peak f produces
interesting points for characterizing image surface. Recently,
one analyzes image not only from its gray function, but at
several scales and even at different color channels.
Consequently, we can find different ridges and peaks at
different scales. Extracting ridge and peak at several scales
takes an advantage: at small scale, ridges represent details of
object; at bigger scale, ridges represent global structure.
Therefore, the tree constructed from ridges has very small
number of nodes at the root and more number of nodes at the
bottom. The matching beginning from root can be stopped at
certain level if two nodes are too different, which makes faster
the decision.
B. Detection Algorithm
The detection of peak and ridge point consists of 2 stages:
1) Computing main curvatures and main directions at each
point in image:
It is known that two main curvatures are eigenvalues of
Hessian matrix H and two main directions two corresponding
eigenvectors [].
f xx
H
f xy
f xy
f yy
The Hessian matrix is a symmetric matrix. Therefore, it has
two real eigenvalues. From here, two eigenvectors are easily
determined.
2) Verifying if the Laplacian is local extremum in one of
eigenvectors:
For this, we quantize the direction space in 4 principal
directions as in Fig. 2:
2
3
Fig. 2. Quantization of direction space in 4.
The Laplacian at a current point is compared with the value
of Laplacian at two direct neighborhood points in the given
direction. The extremum obtained is “strong extremum”. This
means it is positive biggest or negative smallest than two
others. This guaranties the thinness of the ridge line.
C. Ridge Linking
Ridge points and peaks detected previously are isolated
points. Crowley et al. [] use directly ridge points and peaks to
construct the tree representing a form. We don’t follow this
approach because the tree will become very large when object
is complicated. We propose to use a ridge line corresponding
to a node in the tree. Therefore, it requires to link ridge points.
Fig. 3. Illustration of ridge linking. Points connected and having
a small difference of direction are grouped in a ridge line.
The linking of ridge points is done by grouping ridge points
in a set satisfying two criteria: (1) Points are connected; (2)
Two neighborhoods must have the same main directions. As
the direction was quantized, the second criterion is not strict.
Each ridge line obtained will be labeled for later processing.
D. Some results of ridge and peak detection.
Fig. 4 and Fig. 5 present some results of ridge and peak
detection. Ridges and peaks are detected and localized
correctly. The overlapping of ridges on original image shows
more cleanly this. Moreover, we find that ridges are
continuous, which is desirable characteristic for our
representation by ridge line.
Fig. 4. A zebra image and Ridges and Valleys detected at scale 4.
> REPLACE THIS LINE WITH YOUR PAPER IDENTIFICATION NUMBER (DOUBLE-CLICK HERE TO EDIT) <
3
considered as special cases of ridge point, and they can be
present on ridge line.
B. Constructing the graph from ridges and their spatial
relation.
1) Connectedness of two ridges at consecutive scales
Firstly, we define Z k the region associated to a ridge at a
Fig. 5. An image extracted from soccer video and its valleys detected
at scale 2.
certain scale k a set of points such that the distance from every
point in Z k to ridge line is smaller than k (see Fig. 6).
III. CONTRUCTION OF THE REPRESENTATION FROM RIDGES
A. Representing a ridge
Now, we have ridge lines at different scales. Each ridge line
constitutes a node in the tree representing shape. For each
node, we can attach some information about ridge. We
organize this information in a record of form:
Struct {
Scale;
Length;
Color distribution;
Singular points on ridge (including peaks, interest
points)
Etc …
}RIDGE
1) Determine the ridge length: The length of a ridge is a
total number of points on this ridge. This length is relative to
scale. The bigger scale is, the longer ridge length becomes.
Therefore, to be invariant to scale change, we have to
normalize the ridge length by scale.
2) Compute color distribution: The color distribution of
ridge points is a profile of color of points along the ridge line.
In some cases where the storage of this profile is expensive,
we can replace it by stocking only the entropy of color
distribution because entropy reflects the distribution of a set of
points. The small entropy means ridge points are similar in
color and inverse. We can also take the entropy of color
distribution of all points in the region associated to the ridge
(definition of region associated to a ridge is in section III.B.1).
3) Determine the singular points: A ridge line can be a
curve, not necessarily a straight line. Therefore, we should
characterize this curve by singular points on it. We define a
singular point a point at which the curve has a local maximum
of curvature. This can be done by approximating the ridge line
by a spline [].
P
Rk
Zk
Fig. 6. Region Z k corresponding to a ridge
Rk
Rk be a ridge at scale k, Rk 1 be a ridge at scale (k-1).
We call Rk , Rk 1 are connected if the ridge Rk 1 is in the
region Z k .
Let
2) Construction of the representation
Suppose that object is only significant at some scales in the
interval [N, M]. Firstly, we explain how construct a sub-tree
from ridges at two consecutive scales k and k-1. To construct
the full tree, we apply recursively the algorithm constructing
sub tree to all pair of scales in the interval of scales.
Suppose that at scale k, we have N k ridges. We construct
N k nodes named by Rk1 , Rk 2 , …, RkN k . Each node is
assigned by a record of form as presented in section III.A. For
each node corresponding to ridge Rki , with i[1, N k ], we
determine the associated region
Z ki and look for all ridges at
scale k-1 inside this region. Suppose we find T ridges named
by R( k 1) i1 , R( k 1) i2 ,…, R( k 1) iT . We make a branch between
node Rki and node R( k 1)i , with j [1, T]. This process of
j
constructing sub-tree is shown as in Fig. 7.
k
P5
P1
P3
P2
k-1
P4
Fig. 5. Singular points on ridge
Other types of singular point are peak and saddle point on
ridge line. As we did not have the constraint on sign of main
curvatures, the saddle points and peak points can be
The sub-tree
obtained
from from
twotwoscale
levels in above
Fig. 7. Sub-tree
constructed
scale levels
example is illustrated as in Fig. 8.
Ri
k
k-1
> REPLACE THIS LINE WITH YOUR PAPER IDENTIFICATION NUMBER (DOUBLE-CLICK HERE TO EDIT) <
4
the graph G such that thay are the most similar the one the
other. We use a threshold for Mahanalobis distance to choose
the most similar node.
The recognition of an object is determined by the ratio of
the number of nodes matched and total number of nodes on
two trees. We can also use the sum of Mahanalobis distances
to decide the most correspondence.
V. COMPARAISON WITH TWO EXISTING APPROACHES
It is possible that at certain scale k the associated regions to
two near ridges can be overlapped. Therefore, some ridges at
lower scale k-1 can be inside of both regions. The problem is
to decide which node in the level k we should make the
connection with. It is natural that we can make two branches
with both of two nodes. Nevertheless, this gives a graph, not a
tree. Matching graphs is more complicated than matching
trees. We propose a reasonable solution as follow: we make a
connection only with node at higher scale that the associated
region contains the maximal number of points on the ridge at
lower scale.
The above algorithm will be applied to all ridges at all pair
of scales. This gives finally a tree or a forest. The case of
forest happens when at highest level, there is more than one
ridges detected. In this case, we add a “white” node as root of
tree.
IV. MATCHING STRATEGY
Matching two trees is in fact We propose a strategy for
matching two trees representing objects obtained from section
III.B.2 as follow.
For simplicity, we explain how to compare two trees having
only a root and direct children. In general case, we apply this
algorithm recursively at every levels of the tree.
Suppose that we have two trees T et T’ like in the Fig. 9. T
is a prototype model in the base of models. T’ is a model of
new object to be recognized.
R( k 1)i and R('t 1) j two roots of
these trees respectively.
Fig. 9. Matching two trees. Nodes of same color are similar. The
reliability of recognition is determined in this example = 0.66.
Firstly, we compare two nodes
R( k 1)i and R('t 1) j . If two
ridges corresponding are similar, we continue to compare
nodes at lower level. If not, we stop. The similarity of two
ridges is measured by Mahanalobis distance of these ridges.
Each field in the record representing ridge can be weighted to
the importance of each information for ridge.
In case where two root nodes are similar, we continue to
compare nodes at lower level. More precisely, for each node
Rtn' at level t in graph G’, we look for a node Rkm at level k in
In this section, we compare some properties of our
representation approach with two existing approaches. We’ll
compare two aspects of approach: representation and
matching.
A. Comparison with “An image understanding system using
attributed Symbolic Representation and inexact GraphMatching” proposed by M. A. Eshera et al. 1986
In [1], M. A. Eshera et al. proposed an approach to
represent object by an attributed relational graph (ARG). ARG
is a graph consisting of nodes and branches. Both nodes and
branches have some attributes assigned to them. The extraction
of ARG from image is achieved by a multilayer graph
transducer scheme. At each layer, the transducer performs a
symbolic mapping of image information from a local alphabet
into a relatively more global alphabet. The bottom layer is
considered at first while the top layer is in the last layer of
scheme. The input alphabet of the scheme consists of a set of
image primitives, for example contours. This alphabet is
transformed to set of output alphabets consisting of short lines
of the first layer and this output becomes input to create the
output alphabet consisting of longer line segments of the
second layer and so on. Each node in graph is an element in
the set of alphabets. Each branch represents the relations
between nodes.
Firstly, we find that this approach represents object by a
graph. The our represents object by a tree that is easier for
analysis as well as matching. The attributes, in this approach is
assigned to both node and branch while in the ours, only they
are only assigned to node. The fact of assigning the attributes
to branches make more informative and more discriminant the
representation. This can be an amelioration of our approach.
Secondly, the construction of the graph ARG is performed at
several layers. When layer increases, more global information
is obtained. Our construction of tree is achieved at several
scales. At bigger scale, we have ridge representing global
structure of object. In certain sense, both approaches are multi
resolution. However, as the representation in this approach is a
graph, the nodes at each layer are not distinct. Our approach
can distingue nodes at each layer, the matching layer by layer
is simpler.
> REPLACE THIS LINE WITH YOUR PAPER IDENTIFICATION NUMBER (DOUBLE-CLICK HERE TO EDIT) <
B. Comparison with “A Representation for Shape Based on
Peaks and Ridges in the Difference of Low Pass Transform”
by J. Crowley et al. 1984
J. Crowley et al. proposed in [] a multiple resolution
representation for the two-dimensional gray-scale shapes in
an image. This representation is constructed by detecting peaks
and ridges in the Difference of Low Pass (DOLP) transform. A
form is described by a tree of symbols of type {M, L, P, R}
(more details see []) which represent the structure of the form
at every resolution. In this way, each point detected forms a
node in the tree and the neighborhood relation between these
points makes a connection between nodes. No attributes
assigned at each node or branch.
This representation gives a very large tree when object is
complicated because that used each point as a node in the tree.
This representation its self conserves the structural information
about form. As the same our approach, all scales are
considered.
VI. CONCLUSION
The principal topic discussed in this paper is a syntactic
representation for object in 2D image, which is composed of
ridge detected at different scales of the image. Each object is
modelized by a tree consisting of nodes corresponding to
symbols RIDGE and branches representing the spatial relation
between ridges at consecutives scales. The attributes of ridge
assigned at each node permits a more compact, concise and
powerful representation that is capable of comprehending
majority information contents in images. We also proposed a
strategy for matching two representations. However, the results
of representation and recognition were not described. In the
feature work, we attempt to implement this approach and
realize a comparative evaluation of this approach respect to
other approaches.
REFERENCES
[1]
M. A. Eshera and King-Sun Fu, “An Image Understanding System
Using Attributed Symbolic Representation and Inexact GraphMatching”, IEEE Transactions on PAMI, PAMI 8(5), pp. 604- 616,
Sept 1986.
[2]
J. L. Crowley and A. C. Parker, "A Representation for Shape Based on
Peaks and Ridges in the Difference of Low Pass Transform", IEEE
Transactions on PAMI, PAMI 6 (2), March 1984.
5

