Interval Estimation & Hypothesis Testing Review Problems
advertisement
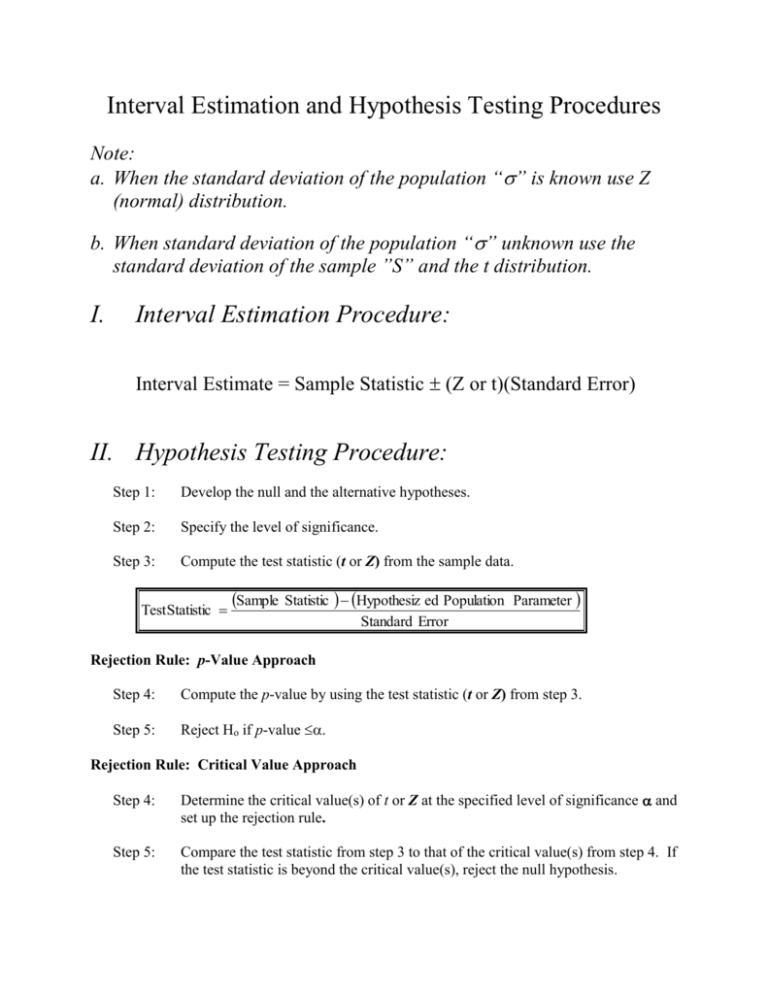
Interval Estimation and Hypothesis Testing Procedures Note: a. When the standard deviation of the population “” is known use Z (normal) distribution. b. When standard deviation of the population “” unknown use the standard deviation of the sample ”S” and the t distribution. I. Interval Estimation Procedure: Interval Estimate = Sample Statistic (Z or t)(Standard Error) II. Hypothesis Testing Procedure: Step 1: Develop the null and the alternative hypotheses. Step 2: Specify the level of significance. Step 3: Compute the test statistic (t or Z) from the sample data. Test Statistic Sample Statistic Hypothesiz ed Population Parameter Standard Error Rejection Rule: p-Value Approach Step 4: Compute the p-value by using the test statistic (t or Z) from step 3. Step 5: Reject Ho if p-value . Rejection Rule: Critical Value Approach Step 4: Determine the critical value(s) of t or Z at the specified level of significance and set up the rejection rule. Step 5: Compare the test statistic from step 3 to that of the critical value(s) from step 4. If the test statistic is beyond the critical value(s), reject the null hypothesis. Review Problems for Chapters 8 and 9 Interval Estimation and Hypothesis Testing I. Means 1. The Standard Deviation of the population is known. Chattanooga Paper Company makes various types of paper products. One of their products is a 30 mils thick paper. In order to ensure that the thickness of the paper meets the 30 mils specification, random cuts of paper are selected and the thickness of each cut is measured. A sample of 256 cuts had a mean thickness of 30.3 mils. From past information it is known that the standard deviation of the population is known to be 4 mils. a. Develop a 95% confidence for the thickness of the paper. b. The company considers the production in control if the thickness does not deviate from the desired 30 mils by more than + 3%. Is the production in control? Explain. c. At 95% confidence, test to see if the mean thickness is significantly more than 30 mils. d. Compute the p-value and interpret its meaning. Professor Ahmadi’s lecture notes 2 2. The Standard Deviation of the population is unknown. The cost of a roll of camera film (35 mm, 24 exposure) in a sample of 12 cities worldwide is shown below. City Rio de Janeiro Stockholm Tokyo Moscow Paris London New York Mexico City Sydney Honolulu Cairo Hong Kong Cost (in dollars) 12.14 7.47 6.56 5.69 5.62 5.41 4.33 4.00 3.62 3.43 3.40 2.73 a. Using Excel, compute the basic descriptive statistics (the mean, the median, the mode, the standard deviation, and the standard error of the mean) for the cost of film. b. Determine a 95% confidence interval for the population mean. c. At 95% confidence test to determine if the average price is significantly different from $3.50? d. Estimate the p-value and explain its meaning. Professor Ahmadi’s lecture notes 3 II. Proportions 3. In a random sample of 400 employees of a local company 180 were female. a. At 95% confidence determine if the proportion of females in the company is significantly less than 50%. b. Compute the p-value and explain its meaning. 4. Many people who bought Xbox gaming systems, have complained about having received defective systems. In a sample of 1200 units sold, 18 units were defective. a. Determine a 95% confidence interval for the percentage of defective systems. b. If 1.5 million Xboxes were sold, determine an interval for the number of defectives. c. At 95% confidence, test to see if the percentage of defective systems produced by Xbox has exceeded the industry standard. The industry standard for such systems has been 99 percent non-defective systems d. Compute the p-value and interpret its meaning. Professor Ahmadi’s lecture notes 4 Reading the “t” and the “Z” values For each of the following, read the t statistic from the table and write its value in the space provided. 1. A Two-Tailed Test, a sample of 29 at 80% confidence t = ? 2. A One-Tailed Test (upper tail), a sample size of 26 at 90% confidence t = ? 3. A One-Tailed Test (lower tail), a sample size of 22 at 95% confidence t = ? For each of the following, read the Z statistic from the table and write its value in the space provided. 4. A Two-Tailed Test at 98.4% confidence Z = ? 5. A One-Tailed Test (lower tail) at 89.8% confidence Z = ? 6. A One-Tailed Test (upper tail) at 93.7% confidence Z = ? Professor Ahmadi’s lecture notes 5 Your Turn 1. A random sample of 64 SAT scores of students applying for merit scholarships showed an average of 1400 with a sample standard deviation of 240. Provide a 95% confidence interval for the SAT scores of all the students who applied for the merit scholarships. 2. In the last presidential election, a sample of 800 registered voters in California showed that 200 of them voted for the incumbent president. Develop a 95% confidence interval estimate for the proportion of all California registered voters who voted for the incumbent president. 3. From a population of cereal boxes marked "12 ounces," a sample of 64 boxes is selected and the content of each box is weighed. The sample revealed a mean of 11.7 ounces with a standard deviation of 1.6 ounces. a. Using the critical value approach, test to see if the mean of the population is significantly less 12 ounces. Use a 0.05 level of significance. b. Using the p-value approach, test to see if the mean of the population is significantly less than 12 ounces. Use a 0.05 level of significance. Professor Ahmadi’s lecture notes 6

