2002_APSTATS_MC 11,12,13,14,15
advertisement

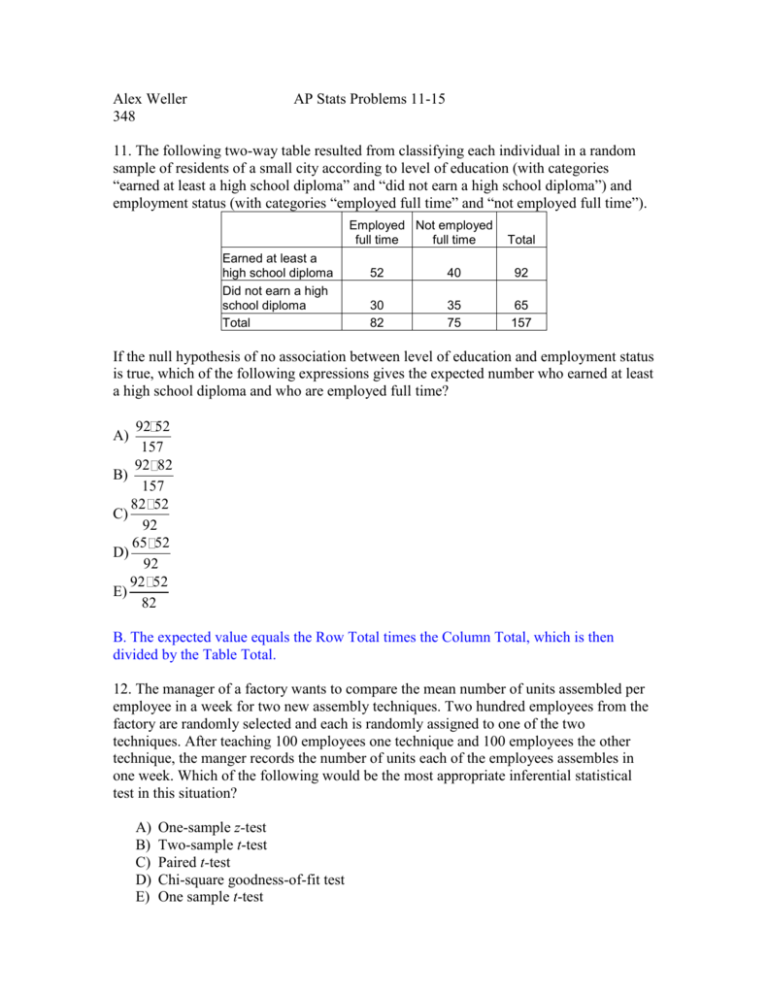
Alex Weller 348 AP Stats Problems 11-15 11. The following two-way table resulted from classifying each individual in a random sample of residents of a small city according to level of education (with categories “earned at least a high school diploma” and “did not earn a high school diploma”) and employment status (with categories “employed full time” and “not employed full time”). Employed Not employed full time full time Earned at least a high school diploma Did not earn a high school diploma Total Total 52 40 92 30 82 35 75 65 157 If the null hypothesis of no association between level of education and employment status is true, which of the following expressions gives the expected number who earned at least a high school diploma and who are employed full time? 92 52 157 92 82 B) 157 82 52 C) 92 65 52 D) 92 92 52 E) 82 A) B. The expected value equals the Row Total times the Column Total, which is then divided by the Table Total. 12. The manager of a factory wants to compare the mean number of units assembled per employee in a week for two new assembly techniques. Two hundred employees from the factory are randomly selected and each is randomly assigned to one of the two techniques. After teaching 100 employees one technique and 100 employees the other technique, the manger records the number of units each of the employees assembles in one week. Which of the following would be the most appropriate inferential statistical test in this situation? A) B) C) D) E) One-sample z-test Two-sample t-test Paired t-test Chi-square goodness-of-fit test One sample t-test B. There are two independent samples and the population standard deviation is unknown. 13. A random sample has been taken from a population. A statistician, using this sample, needs to decide whether to construct a 90 percent confidence interval for the population mean or a 95 percent confidence interval for the population mean. How will these intervals differ? A) The 90 percent confidence interval will not be as wide as the 95 percent confidence interval. B) The 90 percent confidence interval will be wider than the 95 percent confidence interval. C) Which interval is wider will depend on how large the sample is. D) Which interval is wider will depend on whether the sample is unbiased. E) Which interval is wider will depend on whether a z-statistic or a t-statistic is used. A. The wider the interval, the more confident you are that the true mean is inside the interval. So the higher the confidence level, the more confident you are. Data set I Data set II _________________________ 20 30 35 45 50 60 14. The boxplots shown above summarize two data sets, I and II. Based on the boxplots, which of the following statements about these two data sets CANNOT be justified? A) The range of data set I is equal to the range of data set II. B) The interquartile range of data set I is equal to the interquartile range of data set II. C) The median of data set I is less than the median of data set II. D) Data set I and data set II have the same number of data points. E) About 75% of the values in data set II are greater than or equal to about 50% of the values in data set I. D. The lines on a boxplot are the first, second, and third quartiles, plus the maximum and minimum numbers, not actual data points. The two data sets could have any number of data points, but similar quartiles. 15. A high school statistics class wants to conduct a survey to determine what percentage of students in the school would be willing to pay a fee for participating in after-school activities. Twenty students are randomly selected from each of the freshman, sophomore, junior, and senior classes to complete the survey. This plan is an example of which type of sampling? A) B) C) D) E) Cluster Convenience Simple Random Stratified Random Systematic D. The sample is randomly selected, but they are still in groups of freshmen, sophomores, juniors, and seniors. That way, an overall conclusion can be made as well as individual conclusions for each grade.


