CODE BOOK
advertisement

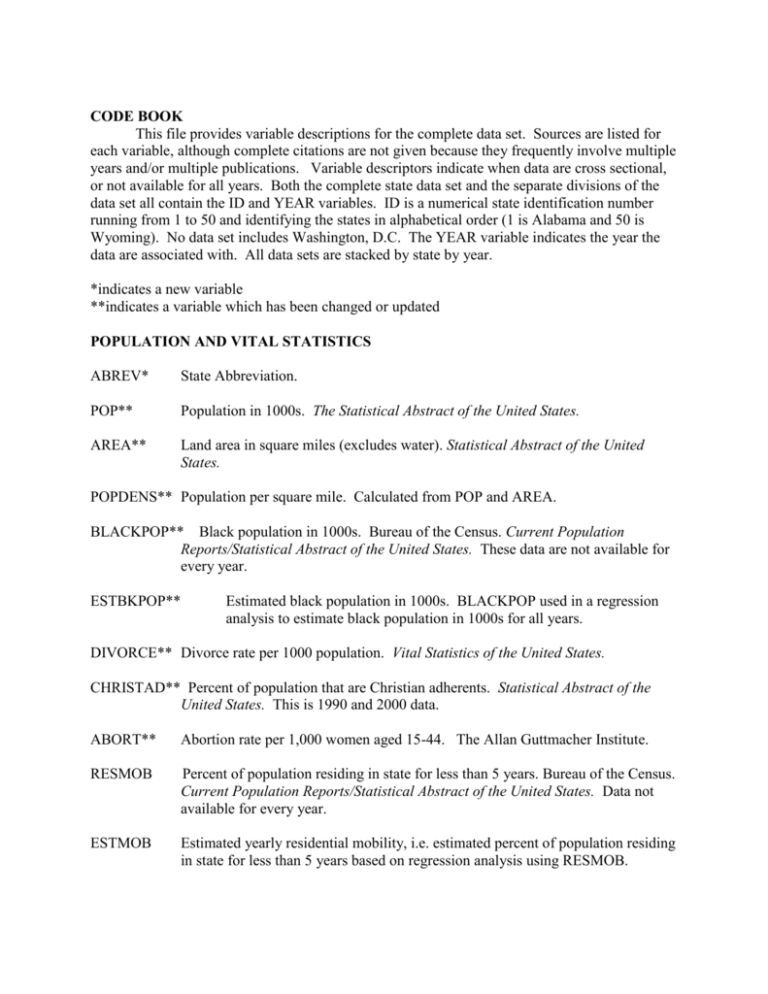
CODE BOOK This file provides variable descriptions for the complete data set. Sources are listed for each variable, although complete citations are not given because they frequently involve multiple years and/or multiple publications. Variable descriptors indicate when data are cross sectional, or not available for all years. Both the complete state data set and the separate divisions of the data set all contain the ID and YEAR variables. ID is a numerical state identification number running from 1 to 50 and identifying the states in alphabetical order (1 is Alabama and 50 is Wyoming). No data set includes Washington, D.C. The YEAR variable indicates the year the data are associated with. All data sets are stacked by state by year. *indicates a new variable **indicates a variable which has been changed or updated POPULATION AND VITAL STATISTICS ABREV* State Abbreviation. POP** Population in 1000s. The Statistical Abstract of the United States. AREA** Land area in square miles (excludes water). Statistical Abstract of the United States. POPDENS** Population per square mile. Calculated from POP and AREA. BLACKPOP** Black population in 1000s. Bureau of the Census. Current Population Reports/Statistical Abstract of the United States. These data are not available for every year. ESTBKPOP** Estimated black population in 1000s. BLACKPOP used in a regression analysis to estimate black population in 1000s for all years. DIVORCE** Divorce rate per 1000 population. Vital Statistics of the United States. CHRISTAD** Percent of population that are Christian adherents. Statistical Abstract of the United States. This is 1990 and 2000 data. ABORT** Abortion rate per 1,000 women aged 15-44. The Allan Guttmacher Institute. RESMOB Percent of population residing in state for less than 5 years. Bureau of the Census. Current Population Reports/Statistical Abstract of the United States. Data not available for every year. ESTMOB Estimated yearly residential mobility, i.e. estimated percent of population residing in state for less than 5 years based on regression analysis using RESMOB. CRIME MURDER** Murders per 100,000 population. Uniform Crime Reports. FBI. RAPE** Rapes per 100,000 population. Uniform Crime Reports, FBI. ROBBERY** Robberies per 100,000 population. Uniform Crime Reports, FBI. ASSAULT** Aggravated assaults per 100,000 population. Uniform Crime Reports, FBI. BURGLARY** Burglaries per 100,000 population. Uniform Crime Reports, FBI. LARCENY** Larcenies and thefts per 100,000 population. Uniform Crime Reports, FBI. MVTHEFT** Motor vehicle thefts per 100,000 population. Uniform Crime Reports, FBI. PRISPOP Number of prisoners sentenced to 12 months or longer per 100,000 population. Sourcebook of Criminal Justice Statistics. Bureau of Criminal Justice Statistics. POLICE** Total number of police officers in FTEs. Sourcebook of Criminal Justice Statistics. Bureau of Justice Statistics. DEATHST** Death Penalty State. EXECUTE** Number of executions performed in that state for years: 96-99. Uniform Crime Reports POLICEEX** Police Expenditures (In millions). US Census Bureau CORRECT** Total Corrections Expenditures (In millions). US Census Bureau ECONOMIC AND BUSINESS CODEBOOK UNEMP** Unemployment rate, measured as percentage of states labor force that it is out of work. Geographical Profile of Employment and Unemployment. Bureau of Labor Statistics. MINUEMP Unemployment rate among non-whites. Geographical Profile of Employment and Unemployment. Bureau of Labor Statistics. GSP** Gross State Product in Billions. Regional Economic Information System (REIS). Bureau of Economic Analysis. GSPPRCAP**Gross State Product Per Capita. GSP divided by state population. PRCAPINC** Per capita income in current dollars. REIS and Statistical Abstract of the United States. CONSTINC**Per capita income in constant (1996) dollars. REIS and Statistical Abstract of the United States. BANKRUPT**Number of bankruptcies filed in 1,000s. Statistical Abstract of the United States. TAXCOLL** Total tax revenues in millions. State Government Tax Collections. Bureau of The Census. PRODUC GSP per worker. REIS and Statistical Abstract of the United States. FEMLAB** Participation rate of females in the labor force. Statistical Abstract of the United States. (1998 not available) DEFEXPEN Defense expenditures per capita. Federal Expenditures by State. Office of Management and Budget/Bureau of the Census. LOTTOSA* Lottery ticket sales excluding commissions. US Census Bureau LOTTOAW* Lottery prize amounts awarded. US Census Bureau LOTTOAD* Lottery administration costs. US Census Bureau LOTTOPR * Lottery proceeds (money the state makes after awarding prizes and paying administrative costs). US Census Bureau REVENUE** Total State Revenue (In millions). US Census Bureau SALETAX** General Sales Tax (In millions). US Census Bureau INCOMETX** Individual Income Tax (In millions). US Census Bureau EXPEND** Total State Expenditures (In millions). US Census Bureau WELFARE** *Public Welfare Expenditures (In millions). US Census Bureau EDUCATION CODE EDSPEND** Total expenditures on secondary and elementary education in 1000s of current dollars. Digest of Education Statistics. EDCOM Educational expenditures as percent of personal income. Digest of Education Statistics/The Statistical Abstract of the United States. PRPUP** Per pupil expenditures in constant (1992) dollars. National Center for Education Statistics. State Comparisons of Education Statistics. ESTSAT This variable attempts to overcome the selection bias problem with ACT/SAT scores by reporting SAT scores for SAT dominant states, and transforming ACT scores from ACT dominant states into an estimated SAT score. Data is from Digest of Education Statistics and the National Center of Education Statistics. Calculation of SAT for ACT dominant states is from Wainer, H. 1986. “Five Pitfalls Encountered When Trying to Compare States on Their SAT Scores.” Journal of Educational Measurement. 23: 69-81. See also, Lehnen, R. Policy Studies Journal. 20: 22-40. EQUITY A 0-100 index with 100 indicating complete equity (all districts spend exactly the same per pupil). This is a cross sectional variable--i.e. no variation by time. Quality Counts: A Report Card on the Condition of Public Education in the 50 States. 1997. Washington, D.C.: Education Week/Pew Charitable Trusts. HSDIP** Percent of population that has at least a high school diploma. National Center for Education Statistics. State Comparisons of Education Statistics. This is a cross sectional variable reflecting the 1990 decennial census. EDCOM2 Total primary and secondary education spending as a percent of Gross State Product. National Center for Education Statistics. State Comparisons of Education Statistics/Bureau of Economic Analysis. Regional Economic Information System (REIS). SATPERC* Percent of high school graduates taking the SAT for years: 96, 97, 99 (Be aware that ACT dominant states will have very low values). Digest of Education Statistics POLITICS WOMLEG** Percent of state legislators that are women. Center for American Women and Politics. POLCOMP Political competition index. This is a cross sectional variable--i.e. no variation across time. Taken from Holbrook and Van Dunk. 1993. American Political Science Review.87: 955-962. CAMPSPND Total congressional general election campaign expenditures per eligible voter. Almanac of American Politics. The Book of the States. TURNOUT** Percent of eligible voters casting ballots in races for the U.S. House of Representatives. The Statistical Abstract of the United States. UNIFCONT 1 equals unified partisan control of executive and legislative branches of government. 0 equals divided government. The Statistical Abstract of the United States/Congressional Quarterly Weekly Report.


