Fitness for Theatre Assessment: supplementary tables
advertisement
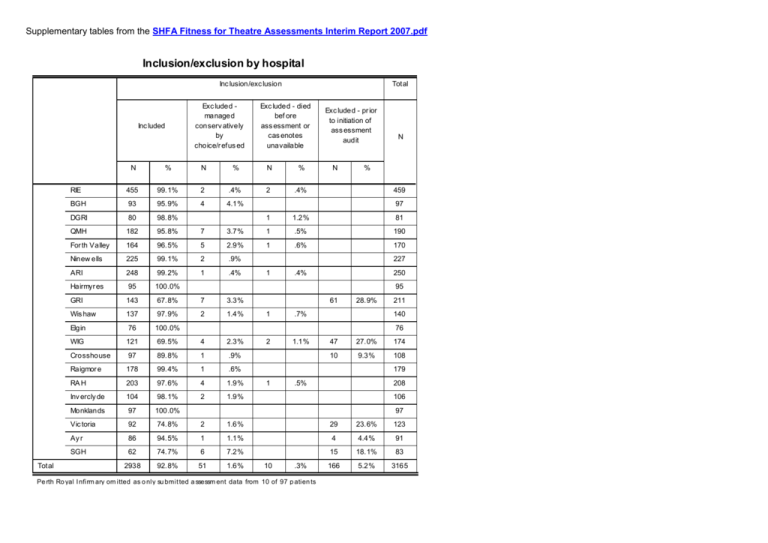
Supplementary tables from the SHFA Fitness for Theatre Assessments Interim Report 2007.pdf Inclusion/exclusion by hospital Inc lusion/exc lusion Inc luded Total Exc luded managed conserv atively by choice/r efus ed Total Exc luded - died bef ore ass essment or cas enotes unavailable Exc luded - pr ior to initiation of ass essment audit N N N % N % N % % RIE 455 99.1% 2 .4% 2 .4% BGH 93 95.9% 4 4.1% DGRI 80 98.8% QMH 182 95.8% 7 For th Valley 164 96.5% 5 Ninew ells 225 99.1% 2 .9% ARI 248 99.2% 1 .4% Hairmyr es 95 100.0% GRI 143 67.8% 7 3.3% Wis haw 137 97.9% 2 1.4% Elgin 76 100.0% WIG 121 69.5% 4 2.3% Crosshouse 97 89.8% 1 .9% Raigmor e 178 99.4% 1 .6% RA H 203 97.6% 4 1.9% Inv ercly de 104 98.1% 2 1.9% Monklands 97 100.0% Vic toria 92 74.8% 2 1.6% 29 23.6% 123 Ay r 86 94.5% 1 1.1% 4 4.4% 91 SGH 62 74.7% 6 7.2% 15 18.1% 83 2938 92.8% 51 1.6% 166 5.2% 3165 459 97 1 1.2% 81 3.7% 1 .5% 190 2.9% 1 .6% 170 227 1 .4% 250 95 61 1 28.9% .7% 211 140 76 2 1.1% 47 27.0% 174 10 9.3% 108 179 1 .5% 208 106 97 10 .3% Pe rth Ro yal I nfirm ary om itted as o nly su bmit ted a ssessm ent data from 10 of 97 p atien ts Who completed the assessment proforma? Proforma filled in by Medical staff Total Loc al A udit Co-ordinator N Hospital Total N % N % RIE 257 56.5 198 43.5 455 BGH 77 82.8 16 17.2 93 DGRI 69 86.3 11 13.8 80 QMH 89 48.9 93 51.1 182 For th Valley 128 78.0 36 22.0 164 Ninew ells 118 52.4 107 47.6 225 ARI 110 44.4 138 55.6 248 Hairmyr es 65 68.4 30 31.6 95 GRI 61 42.7 82 57.3 143 Wis haw 59 43.1 78 56.9 137 Elgin 57 75.0 19 25.0 76 WIG 34 28.1 87 71.9 121 Crosshouse 57 58.8 40 41.2 97 Raigmor e 121 68.0 57 32.0 178 RA H 195 96.1 8 3.9 203 Inv ercly de 23 22.1 81 77.9 104 Monklands 37 38.1 60 61.9 97 Vic toria 36 39.1 56 60.9 92 Ay r 45 52.3 41 47.7 86 SGH 13 21.0 49 79.0 62 1651 56.2 1287 43.8 2938 Summary of fitness for theatre decisions at first and subsequent re-assessments by hospital As sess ment theatre delay Not pos tponed Hospital Total Postponed, subsequently operated Total Postponed, subsequently conserv ative/ palliative N N N % N % % RIE 372 81.8% 83 18.2% 455 BGH 75 80.6% 18 19.4% 93 DGRI 66 82.5% 13 16.3% 1 1.3% 80 QMH 154 84.6% 23 12.6% 5 2.7% 182 Forth V alley 120 73.2% 38 23.2% 6 3.7% 164 Ninew ells 169 75.1% 51 22.7% 5 2.2% 225 ARI 210 84.7% 32 12.9% 6 2.4% 248 Hairmyr es 70 73.7% 21 22.1% 4 4.2% 95 GRI 82 57.3% 55 38.5% 6 4.2% 143 Wishaw 100 73.0% 29 21.2% 8 5.8% 137 Elgin 58 76.3% 12 15.8% 6 7.9% 76 WIG 89 73.6% 26 21.5% 6 5.0% 121 Crosshouse 67 69.1% 26 26.8% 4 4.1% 97 Raigmor e 140 78.7% 35 19.7% 3 1.7% 178 RA H 158 77.8% 38 18.7% 7 3.4% 203 Inv ercly de 68 65.4% 32 30.8% 4 3.8% 104 Monklands 71 73.2% 21 21.6% 5 5.2% 97 Vic toria 77 83.7% 13 14.1% 2 2.2% 92 Ay r 60 69.8% 24 27.9% 2 2.3% 86 SGH 44 71.0% 18 29.0% 2250 76.6% 608 20.7% 62 80 2.7% 2938 Assessor specialty by hospital Specialty of asses sor Anaesthesia Orthopaedic COE Ac ute medicine Total know n grades Other Mis sing data Recorded Total, all patients Not recorded N Hospital Total N % N % N % N % N % RIE 424 94% 19 4% 5 1% 2 0% 1 0% BGH 85 91% 8 DGRI 75 94% QMH 160 For th Valley 121 Ninew ells N N % N % 451 451 99% 4 1% 9% 93 93 100% 93 5 6% 80 80 100% 80 88% 21 12% 181 181 99% 1 1% 182 75% 38 24% 2 1% 161 161 98% 3 2% 164 189 86% 27 12% 3 1% 219 219 97% 6 3% 225 ARI 183 94% 12 6% 195 195 79% 53 21% 248 Hairmyr es 87 95% 3 3% GRI 88 83% 18 17% Wis haw 116 85% 20 15% Elgin 67 92% 4 5% WIG 102 85% 12 10% Crosshouse 75 77% 22 23% Raigmor e 154 87% 24 13% RA H 176 87% 27 13% Inv ercly de 92 88% 11 11% 1 Monklands 91 94% 5 5% 1 Vic toria 58 95% 3 5% Ay r 67 78% 19 22% SGH 59 97% 1 2% 2469 88% 299 11% 2 1 2 92 92 97% 3 3% 95 106 106 74% 37 26% 143 137 137 100% 73 73 96% 3 4% 76 120 120 99% 1 1% 121 97 97 100% 97 178 178 100% 178 203 203 100% 203 1% 104 104 100% 104 1% 97 97 100% 61 61 66% 86 86 100% 61 61 98% 1 2% 62 2795 2795 95% 143 5% 2938 1% 3% 4 7 2% 0% 455 3% 1 2% 17 1% 2 3 2% 0% 137 97 31 34% 92 86 Fitness for theatre decisions at first and subsequent re-assessments by grade of assessor As sess ment theatre delay Not pos tponed Specialty of ass essor Pos tponed, subsequently conserv ative/palliative N N % N % N % Anaesthesia 2117 86% 322 13% 30 1% 2469 Orthopaedic 34 11% 44 15% 299 221 74% COE 7 100% Ac ute medicine 13 76% Other 3 100% NR Total Pos tponed, subsequently operated Total 7 4 24% 17 3 99 69% 42 29% 2 1% 143 2250 77% 608 21% 80 3% 2938 Reasons for postponement by hospital No postponement Coag corr/haem Metabolic/renal Cardiac etc Resp/Infection Combined reasons Other medical reason/NR Lack of info Total N % N % N % N % N % N % N % N % N RIE 372 81.8% 11 2.4% 9 2.0% 21 4.6% 7 1.5% 12 2.6% 5 1.1% 18 4.0% 455 BGH 75 80.6% 7 7.5% 1 1.1% 3 3.2% 3 3.2% 1 1.1% 3 3.2% 93 DGRI 66 82.5% 4 5.0% 3 3.8% 2 2.5% 1 1.3% 4 5.0% 80 QMH 154 84.6% 7 3.8% 3 1.6% 5 2.7% 5 2.7% 3 1.6% 2 1.1% 3 1.6% 182 Forth V alley 120 73.2% 6 3.7% 3 1.8% 6 3.7% 12 7.3% 5 3.0% 2 1.2% 10 6.1% 164 Ninew ells 169 75.1% 17 7.6% 4 1.8% 6 2.7% 9 4.0% 14 6.2% 2 .9% 4 1.8% 225 ARI 210 84.7% 4 1.6% 1 .4% 12 4.8% 6 2.4% 8 3.2% 2 .8% 5 2.0% 248 Hairmyr es 70 73.7% 4 4.2% 2 2.1% 5 5.3% 4 4.2% 6 6.3% 4 4.2% 95 GRI 82 57.3% 11 7.7% 2 1.4% 29 20.3% 8 5.6% 4 2.8% 2 1.4% 5 3.5% 143 Wishaw 100 73.0% 6 4.4% 3 2.2% 3 2.2% 7 5.1% 10 7.3% 2 1.5% 6 4.4% 137 Elgin 58 76.3% 1 1.3% 2 2.6% 4 5.3% 2 2.6% 6 7.9% 3 3.9% 76 WIG 89 73.6% 4 3.3% 4 3.3% 3 2.5% 8 6.6% 9 7.4% 2 1.7% 2 1.7% 121 Crosshouse 67 69.1% 11 11.3% 1 1.0% 6 6.2% 5 5.2% 2 2.1% 4 4.1% 1 1.0% 97 Raigmor e 140 78.7% 14 7.9% 1 .6% 5 2.8% 1 .6% 5 2.8% 7 3.9% 5 2.8% 178 RA H 158 77.8% 10 4.9% 5 2.5% 5 2.5% 12 5.9% 7 3.4% 2 1.0% 4 2.0% 203 Inv ercly de 68 65.4% 9 8.7% 2 1.9% 7 6.7% 8 7.7% 5 4.8% 1 1.0% 4 3.8% 104 Monklands 71 73.2% 2 2.1% 1 1.0% 5 5.2% 2 2.1% 7 7.2% 1 1.0% 8 8.2% 97 Vic toria 77 83.7% 4 4.3% 2 2.2% 4 4.3% 1 1.1% 2 2.2% 2 2.2% 92 Ay r 60 69.8% 11 12.8% 2 2.3% 3 3.5% 3 3.5% 6 7.0% 44 71.0% 2 3.2% 4 6.5% 4 6.5% 1 1.6% 3 4.8% 2250 76.6% 145 4.9% 52 1.8% 139 4.7% 106 3.6% 115 3.9% SGH Total Oth er m edica l rea sons includ e ne urolo gical , lack of IT U/HDU, se nior anae stheti st req uirem ent a nd a llerg ies 1 1.2% 36 1.2% 86 4 6.5% 62 95 3.2% 2938 Plans of Action after postponement by reason for delay Plan of Action Further inv estigations Commence treatment Specialist opinion Or ganis e additional res ourc es N % N % N % N % Coagulation correction/haematology 55 30.2% 105 57.7% 9 4.9% 3 1.6% Metabolic/renal 20 29.4% 39 57.4% 5 7.4% Cardiac failure/arrythmias /ischaemia 99 55.9% 24 13.6% 29 16.4% 2 Respiratory/Infec tion 31 22.5% 71 51.4% 19 13.8% Combined reasons 54 30.9% 63 36.0% 35 Other medical reasons or not rec orded 19 43.2% 3 6.8% Lack of Prev ious Medic al His tory, results or preparation 20 19.4% Total 298 33.6% 305 34.4% Total Conserv ative/pal liative N % Get further info Not know n N N % N % 10 5.5% 182 68 1 1.5% 3 4.4% 1.1% 10 5.6% 12 6.8% 2 1.4% 9 6.5% 6 4.3% 138 20.0% 4 2.3% 15 8.6% 4 2.3% 175 12 27.3% 3 6.8% 2 4.5% 3 6.8% 2 1.9% 81 78.6% 111 12.5% 119 13.4% 14 No te tha t som e pa tient s had two docum ente d Pl ans o f Acti on an d wo uld t heref ore b e inc luded twic e 1.6% 37 4.2% 1 2 .6% 4.5% 177 44 103 3 .3% 887 Plans of Action after postponement by hospital Specialist opinion Further inv estigations Commence treatment Specialist opinion Or ganis e additional res ourc es N % N % N % N % RIE 44 40.7% 23 21.3% 17 15.7% 2 1.9% BGH 3 16.7% 11 61.1% 1 5.6% DGRI 3 15.8% 6 31.6% 4 21.1% QMH 6 18.8% 15 46.9% 1 3.1% Forth V alley 24 38.7% 22 35.5% 5 8.1% Ninew ells 16 20.5% 35 44.9% 15 ARI 17 30.4% 7 12.5% Hairmyr es 12 37.5% 9 GRI 41 64.1% Wishaw 15 Elgin 7 WIG 2 6.3% 19.2% 1 1.3% 13 23.2% 3 5.4% 28.1% 3 10 15.6% 28.8% 18 33.3% 6 23 46.9% Crosshouse 10 Raigmor e Total plans of action Conserv ative/ palliative N % Get further info Not know n N N % N % 20 18.5% 2 1.9% 3 16.7% 18 6 31.6% 19 108 3 9.4% 5 15.6% 32 1 1.6% 10 16.1% 62 3 3.8% 8 10.3% 78 5 8.9% 11 19.6% 56 9.4% 1 3.1% 7 21.9% 32 4 6.3% 3 4.7% 6 9.4% 64 34.6% 8 15.4% 4 7.7% 5 9.6% 28.6% 2 9.5% 3 14.3% 3 14.3% 21 20 40.8% 3 6.1% 1 2.0% 1 2.0% 49 26.3% 19 50.0% 7 18.4% 2 5.3% 15 33.3% 14 31.1% 8 17.8% 2 4.4% 6 13.3% 45 RA H 10 18.2% 28 50.9% 6 10.9% 5 9.1% 6 10.9% 55 Inv ercly de 9 19.6% 19 41.3% 8 17.4% 2 4.3% 5 10.9% 46 Monklands 14 34.1% 11 26.8% 4 9.8% 1 2.4% 11 26.8% 41 Vic toria 6 40.0% 6 40.0% 1 6.7% 2 13.3% 15 Ay r 13 38.2% 19 55.9% SGH 10 45.5% 7 31.8% 4 18.2% 298 33.6% 305 34.4% 119 13.4% Total 2 111 1 1 3 1.9% 2.0% 6.5% 1 1.9% 38 5.9% 12.5% 52 34 1 4.5% 14 1.6% No te tha t som e pa tient s had two d ocum ente d Pl ans o f Acti on an d wo uld t heref ore b e inc luded twic e 37 4.2% 22 3 .3% 887 McLaughlin abnormalities McLaughlin et al (2006) 1 defined 11 major classes of clinical abnormalities affecting preoperative status: Angela – could you include link from each of these lines (1-11) to their corresponding tables on pages 12-20? Major Minor Abnormalities: McLaughlin Description SHFA equivalent McLaughlin Description SHFA equivalent 1 Blood pressure (BP) Sys BP <= 90 Sys BP <= 90 Systolic BP >=181; diastolic BP >=111 Systolic BP >=181; diastolic BP >=111 2 Rate and rhythm AF or SVT >= 121; ventricular tachycardia; 3rd degree heart block or heart rate <= 45 bpm Pulse <= 45; Pulse >= 121 & AF/flutter; Pulse >= 121 & highlighted other problem; complete heart block; ventricular tachycardia Atrial fibrillation (AF) or supraventricular tachycardia (SVT) 101-120; sinus tachycardia >= 121; or heart rate 46-50 bpm Pulse 46-50; Pulse >= 121 with no other Rate/Rhythm problem; Pulse 101-120 & AF/flutter; Pulse 101-120 & highlighted other Rate/Rhythm problem 3 Infection/pneumonia Temp < 35C; T >= 38.5 C with clinical diagnosis of pneumonia or infiltrate on CXR Temp < 35C; infection on CXR & temp >= 38.5 C T >= 38.5 C; clinical diagnosis of pneumonia; or infiltrate on CXR T >=38.5 but no documented infection; infection on CXR but T normal or not recorded 4 Chest pain Any new MI on ECG, or chest pain with abnormal ECG Evidence of new MI; angina with ST depression or elevation Chest pain but normal ECG Angina in combination with ischaemia or other highlighted concerns on ECG or otherwise (rhythm, ectopics, pacemaker) 5 Congestive heart failure (CHF) Pulmonary edema on CXR; or CHF on CXR with dyspnea and/or abnormal exam Evidence of failure on CXR; pulmonary oedema; other highlighted CHF problem on CXR; pleural effusion (in absence of infection) Dyspnea or pulmonary rales or S3 but a normal CXR; or CHF on CXR with a normal exam and no dyspnea None 6 Respiratory failure Pulse oximetry < 90%; pO2 < 60 mm Hg (8); or pCO2 >= 55 mm Hg (7.4) O2 sat < 90; pO2 < 8 k/Pa; pCO2 >= 7.4 k/Pa 46 mmHg < pCO2 < 55mmHg (6.27.3) pCO2 >= 6.2-7.3 k/Pa 7 INR > 1.6 > 1.6 1.4-1.6 1.4-1.6 8 Electrolytes Na <= 125 or > 155 mEq/L; K <2.5 or >= 6.1 mEq/L; or HCO3 < 18 or > 36.nEq/L Na <= 125 or > 155mEq/L; K <2.5 or >= 6.1 mEq/L; or HCO3 < 18 or > 36.Eq/L Na 126-128 or 151-155 mEq/L; K 2.5-2.9 or 5.6-6.0 mEq/L; or HCO3 18-19 or 35-36.mEq/L Na 126-128 or 151-155 mEq/L; K 2.5-2.9 or 5.6-6.0 mEq/L; or HCO3 18-19 or 35-36.mEq/L 9 Glucose >600 mg/dL > 33 mmol/L 451-600 mg/dL 25-33 mmol/L 10 BUN/creatinine BUN > 50 mg/dL; or Creatinine >= 2.6 mg/dL without h/o ESRD Urea >= 18 mmol/L; creatinine > 225 umol/L BUN 41-50 mg/dL; or Creatinine 2.12.5 mg/dL without h/o ESRD Urea 14.5-17.9 mmol/L; creatinine 186-225 umol/L 11 Anaemia Hgb <= 7.5 g/dL Hgb <= 7.5 g/dL Hgb <= 7.6-8.0 g/dL Hgb <= 7.6-8.0 g/dL Preoperative status and risk of complications in patients with hip fracture – J Gen Intern Med 2006; 21:219-225 Comments Not included if pt in Sinus Rhythm with AF/flutter only or pulse 101-120 SHFA did not record a variable reflecting dyspnea, pulmonary rales or S3 ESRD not recorded by SHFA Frequency of Abnormalities by hospital Extent of abnormality None Minor Major Multiple major Total patients N % N % N % N % RIE 272 59.8% 107 23.5% 63 13.8% 13 2.9% 455 BGH 51 54.8% 27 29.0% 14 15.1% 1 1.1% 93 DGRI 47 58.8% 21 26.3% 10 12.5% 2 2.5% 80 QMH 111 61.0% 38 20.9% 26 14.3% 7 3.8% 182 For th Valley 87 53.0% 49 29.9% 23 14.0% 5 3.0% 164 Ninew ells 141 62.7% 50 22.2% 30 13.3% 4 1.8% 225 ARI 141 56.9% 68 27.4% 28 11.3% 11 4.4% 248 Hairmyr es 53 55.8% 23 24.2% 15 15.8% 4 4.2% 95 GRI 79 55.2% 38 26.6% 24 16.8% 2 1.4% 143 Wis haw 74 54.0% 43 31.4% 17 12.4% 3 2.2% 137 Elgin 52 68.4% 15 19.7% 4 5.3% 5 6.6% 76 WIG 62 51.2% 33 27.3% 22 18.2% 4 3.3% 121 Crosshouse 50 51.5% 30 30.9% 16 16.5% 1 1.0% 97 Raigmor e 113 63.5% 42 23.6% 18 10.1% 5 2.8% 178 RA H 111 54.7% 55 27.1% 32 15.8% 5 2.5% 203 Inv ercly de 52 50.0% 25 24.0% 24 23.1% 3 2.9% 104 Monklands 44 45.4% 33 34.0% 13 13.4% 7 7.2% 97 Vic toria 49 53.3% 23 25.0% 16 17.4% 4 4.3% 92 Ay r 42 48.8% 23 26.7% 17 19.8% 4 4.7% 86 SGH 26 41.9% 19 30.6% 16 25.8% 1 1.6% 62 1657 56.4% 762 25.9% 428 14.6% 91 3.1% 2938 Total Delay rates in relation to presence/absence of abnormalities by hospital Ex tent of abnormality None No medical reason for delay Minor Medical reas on to delay No medical reason for delay Major Medical reas on to delay No medical reason for delay Multiple major Medical reas on to delay No medical reason for delay Medical reas on to delay Total patients N % N % N % N % N % N % N % N % RIE 251 92.3% 21 7.7% 88 82.2% 19 17.8% 30 47.6% 33 52.4% 3 23.1% 10 76.9% 455 BGH 45 88.2% 6 11.8% 25 92.6% 2 7.4% 5 35.7% 9 64.3% 1 100.0% 93 DGRI 41 87.2% 6 12.8% 19 90.5% 2 9.5% 6 60.0% 4 40.0% 2 100.0% 80 QMH 105 94.6% 6 5.4% 32 84.2% 6 15.8% 16 61.5% 10 38.5% 1 14.3% 6 85.7% 182 Forth V alley 75 86.2% 12 13.8% 33 67.3% 16 32.7% 11 47.8% 12 52.2% 1 20.0% 4 80.0% 164 Ninew ells 122 86.5% 19 13.5% 32 64.0% 18 36.0% 15 50.0% 15 50.0% 4 100.0% 225 ARI 128 90.8% 13 9.2% 60 88.2% 8 11.8% 18 64.3% 10 35.7% 4 36.4% 7 63.6% 248 Hairmyr es 47 88.7% 6 11.3% 15 65.2% 8 34.8% 7 46.7% 8 53.3% 1 25.0% 3 75.0% 95 GRI 60 75.9% 19 24.1% 18 47.4% 20 52.6% 4 16.7% 20 83.3% 2 100.0% 143 Wishaw 65 87.8% 9 12.2% 28 65.1% 15 34.9% 7 41.2% 10 58.8% 3 100.0% 137 Elgin 43 82.7% 9 17.3% 12 80.0% 3 20.0% 2 50.0% 2 50.0% 1 20.0% 4 80.0% 76 WIG 56 90.3% 6 9.7% 23 69.7% 10 30.3% 9 40.9% 13 59.1% 1 25.0% 3 75.0% 121 Crosshouse 45 90.0% 5 10.0% 18 60.0% 12 40.0% 3 18.8% 13 81.3% 1 100.0% Raigmor e 98 86.7% 15 13.3% 34 81.0% 8 19.0% 7 38.9% 11 61.1% 1 20.0% 4 80.0% 178 RA H 94 84.7% 17 15.3% 47 85.5% 8 14.5% 14 43.8% 18 56.3% 3 60.0% 2 40.0% 203 Inv ercly de 46 88.5% 6 11.5% 12 48.0% 13 52.0% 9 37.5% 15 62.5% 1 33.3% 2 66.7% 104 Monklands 35 79.5% 9 20.5% 26 78.8% 7 21.2% 8 61.5% 5 38.5% 2 28.6% 5 71.4% 97 Vic toria 47 95.9% 2 4.1% 21 91.3% 2 8.7% 8 50.0% 8 50.0% 1 25.0% 3 75.0% 92 Ay r 31 73.8% 11 26.2% 15 65.2% 8 34.8% 13 76.5% 4 23.5% 1 25.0% 3 75.0% 86 SGH 21 80.8% 5 19.2% 12 63.2% 7 36.8% 10 62.5% 6 37.5% 1 100.0% 1455 87.8% 202 12.2% 570 74.8% 192 25.2% 202 47.2% 226 52.8% 23 25.3% Total 97 62 68 74.7% 2938 Time from assessment to operation if originally postponed with INR > 1.6 Total Other major abnormalities Yes No Inc luded N % 22% 26 29% 4 17% 16 18% 38% 11 48% 37 41% 13% 3 13% 12 13% 68 100% 23 100% 91 100% Inc luded 68 84% 23 82% 91 83% Ex cluded - not postponed 4 5% 1 4% 5 5% Ex cluded - tr eated conserv atively 3 4% 2 7% 5 5% Ex cluded - missing data 6 7% 2 7% 8 7% 81 100% 28 100% 109 100% N % N % Next day 21 31% 5 +2 days 12 18% +3/5 days 26 6th day or af ter 9 Total Ex cluded patients Total Blood pressure abnormalities and rates of postponement As sess ment theatre delay No medical reason for delay Major, SBP <=90 Minor, SBP >= 181 Blood pressure Minor, SBP (<=180, but DBP >=111 No blood pressur e problem Total Med delay operated Total Med delay cons/pall Count Count % Count % Count % 8 27% 18 60% 4 13% 30 116 73% 40 25% 3 2% 159 5 83% 1 17% 2121 77% 549 20% 73 3% 2743 2250 77% 608 21% 80 3% 2938 6 Rate and Rhythm abnormalities and rates of postponement As sess ment theatre delay No medical reason for delay Rate and rhy thm Med delay cons/pall Count Count Count % Count % Major, pulse <=45 2 40% 3 60% Major, c omplete heart block 1 50% 1 50% 2 Major, pulse >=121 & A F/flutter 1 7% 12 86% 1 7% 14 Major, pulse >=121 & A rr/Br /Tach/Bloc ks 1 20% 1 20% 3 60% 5 Minor, pulse 46-50 8 73% 2 18% 1 9% 11 Minor, pulse 121, no other problem 9 75% 3 25% Minor, pulse 101-120 & AF/f lutter 19 48% 19 48% 2 5% 40 Minor, pulse 101-120 & Arr/Br/Tach/Blocks 14 52% 11 41% 2 7% 27 1 50% 1 50% 2 Minor, pulse 101-120 & Ectopics % 5 12 None, but pulse 101-120 117 74% 33 21% 8 5% 158 None, pulse normal but AF/f lutter 175 56% 122 39% 13 4% 310 None, pulse normal but Arr/Br/Tac h/Blocks 178 77% 43 19% 9 4% 230 None, pulse normal but pacemaker 16 62% 9 35% 1 4% 26 None, pulse normal but Ectopics 29 76% 8 21% 1 3% 38 1680 82% 341 17% 37 2% 2058 2250 77% 608 21% 80 3% 2938 No rhythm & rate problem Total Med delay operated Total Infection/pneumonia abnormalities and rates of postponement As sess ment theatre delay No medical reason for delay Major, T < 35 Infection/pneumonia Count % Count 3 43% Med delay cons/pall % Count % 1 14% Count 3 43% Major, T >= 38.5 & 'Infection' on CXR 1 100% 1 Major, T >= 38.5 & 'Other' inf ection on CXR 1 100% 1 7 Minor, T >= 38.5 no infection documented 9 56% 5 31% 2 13% 16 Minor, 'infection' but T normal/NR 41 45% 43 47% 8 9% 92 Minor, 'Other ' infec tion but T normal/NR No infec tion/pneumonia problem Total Med delay operated Total 14 58% 8 33% 2 8% 24 2183 78% 547 20% 67 2% 2797 2250 77% 608 21% 80 3% 2938 Chest pain abnormalities and rates of postponement As sess ment theatre delay No medical reason for delay Count % Count % Count % 9 41% 8 36% 5 23% 22 1 100% Minor, A ngina + is chaemia 92 67% 37 27% 8 6% 137 Minor, A ngina + abnormal ECG 32 74% 11 26% Minor, A ngina + A rr/Br/Tach/Bloc ks 41 58% 26 37% 4 6% 71 Minor, A ngina + Pacemaker 4 57% 2 29% 1 14% 7 Minor, A ngina + Ec topic s 4 57% 2 29% 1 14% 7 174 77% 47 21% 6 3% 227 1 25% 2 50% 1 25% 4 None, Is chaemia but no angina 139 70% 49 25% 10 5% 198 None, A bnor mal ECG but no angina 82 67% 37 30% 3 2% 122 1672 80% 386 18% 41 2% 2099 2250 77% 608 21% 80 3% 2938 Major, A ngina + ST Dep/Elev Minor, A ngina only None, ST Dep/Elev but no angina No ches t pain abnormality Total Med delay cons/pall Count Major, New MI Chest pain Med delay operated Total 1 43 Congestive heart failure abnormalities and rates of postponement As sess ment theatre delay No medical reason for delay Med delay operated Med delay cons/pall % Count % Count % 26 51% 20 39% 5 10% 3 75% 1 25% Major, 'Other ' CHF problem 7 64% 4 36% Major, Pleural effusion (no infection) 9 60% 3 20% 3 20% 15 None, but Cardiomegaly 45 70% 16 25% 3 5% 64 2163 77% 562 20% 68 2% 2793 2250 77% 608 21% 80 3% 2938 Major, Pulmonary oedema No Congestiv e Heart Failure abnormality Total As sess ment theatre delay No medical reason for delay Total Med delay cons/pall Count Count % Count % Count Major, O2 Sat < 90% 64 65% 30 30% 5 5% 99 Major, pO2 < 8.0 14 42% 15 45% 4 12% 33 Major, pCO2 >= 7.4 2 18% 3 27% 6 55% 11 Minor, pCO2 6.2-7.3 12 57% 6 29% 3 14% 21 None, but pCO2 <4.5 10 38% 15 58% 1 4% 26 2148 78% 539 20% 61 2% 2748 2250 77% 608 21% 80 3% 2938 No Respiratory abnormality Total Med delay operated 51 4 11 Respiratory failure abnormalities and rates of postponement Respiratory f ailure Count Count Major, CXR=Failur e Conges tive Heart Failur e Total % INR abnormalities and rates of postponement As sess ment theatre delay No medical reason for delay Major, INR > 1.6 INR Minor, INR 1.4-1.6 No recorded INR abnor mality Total Med delay operated Total Med delay cons/pall Count Count % Count % Count % 5 5% 99 91% 5 5% 109 15 71% 5 24% 1 5% 21 2230 79% 504 18% 74 3% 2808 2250 77% 608 21% 80 3% 2938 Electrolyte abnormalities and rates of postponement As sess ment theatre delay No medical reason for delay Count % Count % Count % Major: Na < 126 19 58% 13 39% 1 3% 33 Major: Na > 155 1 33% 1 33% 1 33% 3 1 100% 1 Major: K > 6.0 1 11% 7 78% 1 Major: HCO3 < 18 13 65% 6 30% Major: HCO3 > 36 8 57% 4 29% Minor: Na 126-128 48 65% 24 32% Minor: Na 151-155 1 50% 1 50% 2 Minor: K 2.5- 2.9 10 43% 13 57% 23 Minor: K 5.6- 6.0 16 76% 5 24% 21 Minor: HCO3 18-19 18 53% 14 41% Minor: HCO3 35-36 2 67% 1 33% 2113 78% 518 19% 70 3% 2701 2250 77% 608 21% 80 3% 2938 No Elec trolyte abnormality Total Med delay cons/pall Count Major: K < 2.5 Electroly tes Med delay operated Total 11% 9 1 5% 20 2 14% 14 2 3% 74 2 6% 34 3 Glucose abnormalities and rates of postponement As sess ment theatre delay No medical reason for delay Count % Major: Glucose > 33 mmol/l Glucose Minor: Glucose 25-33 mmol/l No Elec trolyte abnormality Total Med delay operated Total Med delay cons/pall Count % Count 1 100% Count % 1 2 100% 2248 77% 607 21% 80 3% 2935 2 2250 77% 608 21% 80 3% 2938 Creatinine abnormalities and rates of postponement As sess ment theatre delay No medical reason for delay BUN/creatinine Med delay cons/pall Count Count % Count % Count % Major: Urea >= 18 & Creatinine > 225 15 41% 18 49% 4 11% 37 Major: Urea >= 18 15 44% 11 32% 8 24% 34 Major: Creatinine > 225 24 71% 9 26% 1 3% 34 Minor: Urea 14.5-17.9 & Creatinine 186-225 8 44% 9 50% 1 6% 18 Minor: Urea 14.5-17.9 42 71% 14 24% 3 5% 59 Minor: Creatinine 186-225 16 55% 11 38% 2 7% 29 2130 78% 536 20% 61 2% 2727 2250 77% 608 21% 80 3% 2938 No Urea/creatinine abnormality Total Med delay operated Total Anaemia abnormalities and rates of postponement As sess ment theatre delay No medical reason for delay Major: Hb <= 7.5 Anaemia Minor: Hb 7.6-8.0 No anaemia abnormality Total Med delay operated Total Med delay cons/pall Count % Count % Count % 4 17% 17 74% 2 9% Count 23 2 17% 8 67% 2 17% 12 2244 77% 583 20% 76 3% 2903 2250 77% 608 21% 80 3% 2938


