Significance of microtopography as a control on surface
advertisement

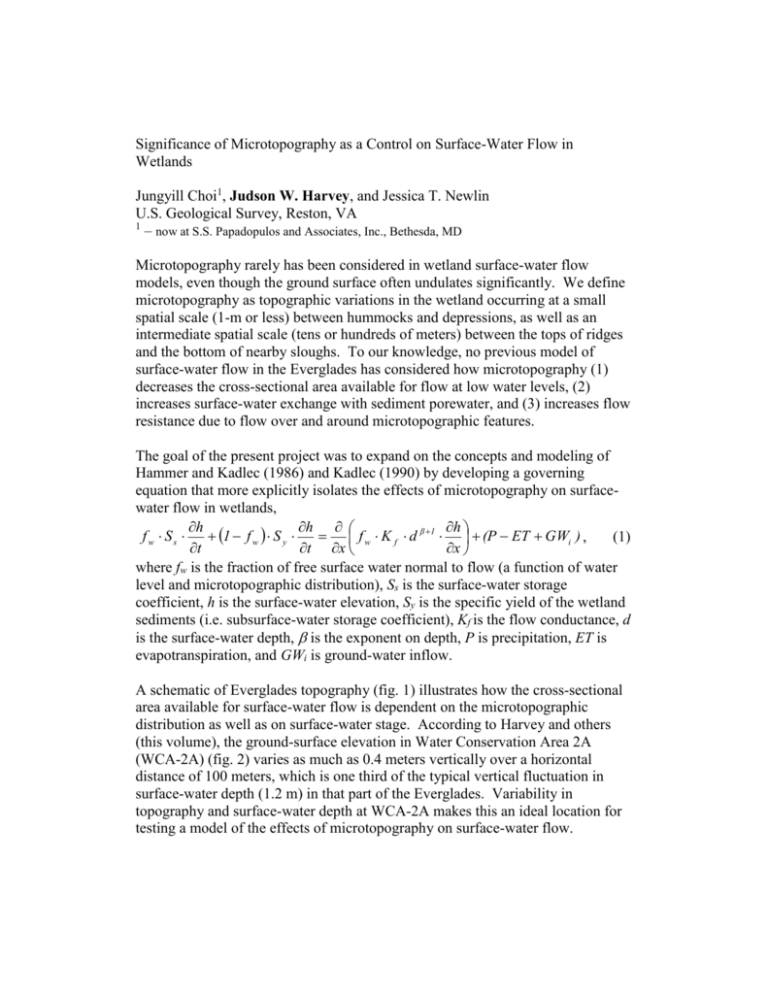
Significance of Microtopography as a Control on Surface-Water Flow in Wetlands Jungyill Choi1, Judson W. Harvey, and Jessica T. Newlin U.S. Geological Survey, Reston, VA 1 – now at S.S. Papadopulos and Associates, Inc., Bethesda, MD Microtopography rarely has been considered in wetland surface-water flow models, even though the ground surface often undulates significantly. We define microtopography as topographic variations in the wetland occurring at a small spatial scale (1-m or less) between hummocks and depressions, as well as an intermediate spatial scale (tens or hundreds of meters) between the tops of ridges and the bottom of nearby sloughs. To our knowledge, no previous model of surface-water flow in the Everglades has considered how microtopography (1) decreases the cross-sectional area available for flow at low water levels, (2) increases surface-water exchange with sediment porewater, and (3) increases flow resistance due to flow over and around microtopographic features. The goal of the present project was to expand on the concepts and modeling of Hammer and Kadlec (1986) and Kadlec (1990) by developing a governing equation that more explicitly isolates the effects of microtopography on surfacewater flow in wetlands, h h h fw Ss 1 f w S y f w K f d β 1 (P ET GWi ) , (1) t t x x where fw is the fraction of free surface water normal to flow (a function of water level and microtopographic distribution), Ss is the surface-water storage coefficient, h is the surface-water elevation, Sy is the specific yield of the wetland sediments (i.e. subsurface-water storage coefficient), Kf is the flow conductance, d is the surface-water depth, is the exponent on depth, P is precipitation, ET is evapotranspiration, and GWi is ground-water inflow. A schematic of Everglades topography (fig. 1) illustrates how the cross-sectional area available for surface-water flow is dependent on the microtopographic distribution as well as on surface-water stage. According to Harvey and others (this volume), the ground-surface elevation in Water Conservation Area 2A (WCA-2A) (fig. 2) varies as much as 0.4 meters vertically over a horizontal distance of 100 meters, which is one third of the typical vertical fluctuation in surface-water depth (1.2 m) in that part of the Everglades. Variability in topography and surface-water depth at WCA-2A makes this an ideal location for testing a model of the effects of microtopography on surface-water flow. Figure 1: Schematic of wetland topography showing change in cross-sectional area for surfacewater flow for “critical” surface-water stages. Figure 2. Water Conservation Area 2A, central Everglades, south Florida. Three different models were applied and compared by selectively combining three effects of microtopography on surface-water flow. Model 1 was the base model simulation, which did not incorporate any of the effects of microtopography. Model 2 included the effects of microtopography on cross-sectional area of surface flow, and surface and porewater exchange. Model 3 included the depthdependent influence of microtopography on flow resistance in addition to those considered by model 2. All three models used daily water levels measured by South Florida Water Management District at sites F1, F4 and U3 in WCA-2A and field measurements of fw, d, Ss, Sy, P, ET, and GWi. The two reaches that were modeled (F1-F4 and F4-U3) differed mainly in their vegetative characteristics (fig. 2). The inverse modeling program, UCODE (http://www.usgs.gov/software/ ucode.html), was used to objectively estimate the optimal values for Kf, and for each model (table 1). Surface-water flow simulations from model 2 showed a 15 percent improvement of the Root Mean Squared Error (RMSE) over the model 1 results, demonstrating that consideration of the effect of microtopography on flow cross-sectional area and storage-exchange improves the accuracy of the surface-water flow model (fig. 3). We observed additional improvements in the model 3 simulation (40 percent decrease in RMSE from that of model 1) through incorporating stage-dependence in the flow parameters, Kf and . The stage-dependent parameters were determined from separate inverse modeling runs of the low-stage period (first 45 days, fig. 3) and the high-stage period (remaining 65 days, fig. 3). Flow parameters in model 3 are varied according to the critical stages defined by field measurements of microtopography at sites F1 and U3 in WCA-2A (fig. 1). Table 1. Optimized flow parameters (Kf, ) for models 1, 2, and 3 as determined from inverse modeling. Notes: Model 3 parameters vary with critical stage (see fig. 1), Parameters vary linearly for depth ranges (c) to (d) and (a) to (b). Model 1 Model 2 Model 3 Stages greater than (d) Stages (c) to (b) Stages less than (a) Reach 1 (F1 to F4) Kf (m/d/m-1) 1.8 x 10⁷ 0.60 3.4 x 10⁷ 0.41 2.5 x 10⁷ 8.2 x 10⁶ 0.98 0.39 0.46 0.00 Reach 2 (F4 to U3) Kf (m/d/m-1) 4.7 x 10⁷ 0.64 8.9 x 10⁷ 0.16 5.6 x 10⁷ 5.6 x 10⁷ 0.98 0.56 0.56 0.00 Figure 3: Comparison of simulation results from models 1, 2, and 3 at site F4 for the entire modeling period (A) and the low-stage modeling period (B). Results of this study indicate that microtopography is a significant control on surface-water flow in the Everglades, especially when the surface-water elevation declines to depths that begin to expose microtopographic highs. Our current modeling effort focuses on objectively determining the critical stages that affect stage-dependence in flow parameters through inverse modeling. References: Hammer, D.E., and Kadlec, R.H. 1986. A model for wetland surface water dynamics: Water Resources Research, vol. 22, no. 13, pp. 1951-1958. Kadlec, Robert H. 1990. Overland flow in wetlands – vegetation resistance: Journal of Hydraulic Engineering, vol. 116, no. 5, pp. 691-706. Judson W. Harvey, U.S. Geological Survey, 430 National Center, Reston, VA 20192, Phone: 703-648-5876, Fax: 703-648-5484, jwharvey@usgs.gov, Hydrology and Hydrologic Modeling


