Data assimilation research and development at EARS in - RC-LACE
advertisement
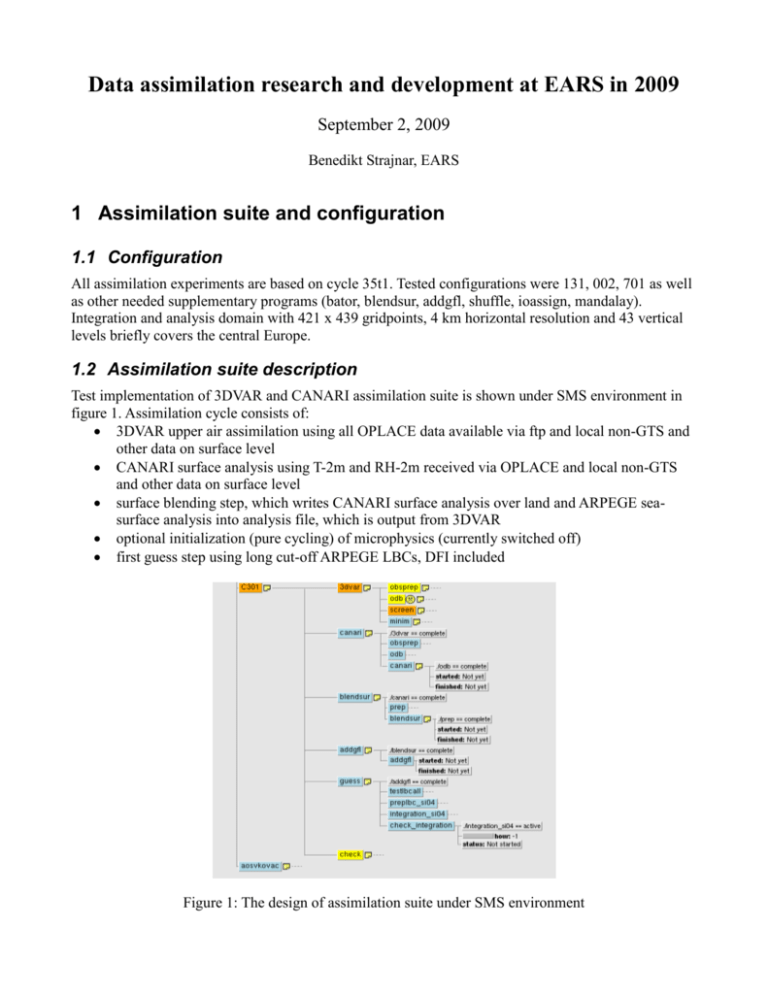
Data assimilation research and development at EARS in 2009 September 2, 2009 Benedikt Strajnar, EARS 1 Assimilation suite and configuration 1.1 Configuration All assimilation experiments are based on cycle 35t1. Tested configurations were 131, 002, 701 as well as other needed supplementary programs (bator, blendsur, addgfl, shuffle, ioassign, mandalay). Integration and analysis domain with 421 x 439 gridpoints, 4 km horizontal resolution and 43 vertical levels briefly covers the central Europe. 1.2 Assimilation suite description Test implementation of 3DVAR and CANARI assimilation suite is shown under SMS environment in figure 1. Assimilation cycle consists of: 3DVAR upper air assimilation using all OPLACE data available via ftp and local non-GTS and other data on surface level CANARI surface analysis using T-2m and RH-2m received via OPLACE and local non-GTS and other data on surface level surface blending step, which writes CANARI surface analysis over land and ARPEGE seasurface analysis into analysis file, which is output from 3DVAR optional initialization (pure cycling) of microphysics (currently switched off) first guess step using long cut-off ARPEGE LBCs, DFI included Figure 1: The design of assimilation suite under SMS environment The assimilation suite can still be regarded as experimental. As a next step the operational environment is being developed under SMS environment which will enable real-time runs. 1.3 Some 3DVAR details In the process of screening, we use variational bias correction. At the end of certain analysis step, we obtain VARBC.cycle file with correction coefficients, which can then be used in the next analysis. We update it only once a day (at 00 UTC) to avoid too strong influence of daily cycle on correction constants. 1.4 B matrix Elements to construct the background error covariance matrix were obtained using ensemble technique. 4 members of ARPEGE assimilation ensemble for the period of April 2008 were downscaled. That produced 60 forecast differences which were the input to FESTAT program to compute auto- and crosscorrelations and forecast error standard deviations. 2 Recent experimental results 2.1 Experiment description The experiment presented in this section began with cold start on May 1, 2009. The assimilation cycle on 4 km domain over central Europe was run till June 14, 2009. It was then stopped because of observational data void. The analyses were taken as initial condition for 48 hour production runs, from May 15, 2009 on. This allows a 15 day warm-up period and mimics the operational situation except that assimilations were not repeated with short cut-off LBC. The production runs were made twice a day, at 00 and 12 UTC. 2.2 Observation usage The observational usage was intended to be complete. We use all available OPLACE data as well as some data on surface level that can be received locally - some non-GTS Slovenian SYNOP stations and some SYNOP data available from bilateral agreements with neighbor countries. Used observation statistics are found on figure 2. The assimilation cut-offs were selected following LACE recommendations. It is worth saying that observational time series were more or less complete, there were few analysis times with no SATOB data or some satellite channels. The assimilation cut-offs were selected following LACE recommendations. Figure 2: Number of available observations and their status in the analysis step (left) and departure statistics for satellite brightness temperature observations (right). 2.3 Objective verification Objective verification was performed using ALADIN verification tool, which runs at EARS. Model forecasts were compared to radiosonde (TEMP) and SYNOP observations at the surface. We first present upper-air scores which are supposed to indicate the relative quality of 3DVAR assimilation step. The verification was made separately for 00 and 12 UTC runs. The experiment was compared to dynamical adaptation at 9 km (operational suite) and at 9 km (parallel suite). Operational cycle at that time was 32t3. For parallel suite, it was already cycle 35t1, but there was an error in climatological files (only for this suite) so the results at lowest levels have to be taken with a little caution. We now highlight the most important score differences that appeared for both 00 and 12 UTC forecast times. The geopotential RMSE is improved with respect to both references in low levels (925 and 850 hPa, figure) and degraded in very high levels (250 hPa). Examples are shown on figure 3. Figure 3: RMSE scores for geopotential height at 850 hPa (left) and 250 hPa (right) for 12 UTC forecasts. Assimilation experiment is in red, operational suite at 9 km in green and parallel suite at 4 km in blue color. The same colors appear in following figures, which present the verification scores. Figure 4 presents some scores for temperature fields. Temperature RMSE was better at 925 hPa and to smaller extent at 850 hPa for the first 12 hours of forecast range. Bias is also visibly improved, also in the ranges between 24 and 36 hours. Also it was seen that assimilation experiment gives much better scores than 4 km dynamical adaptation at those levels. Figure 4: RMSE (left) and bias (right) for 925 hPa temperature forecasts (12 UTC). Assimilation experiment is in red. Relative humidity is the quantity that shows the worse scores for assimilation experiments. For instance at 700 hPa, the scores of operational suite and the assimilation experiment are comparable, but dynamical adaptation at 4 km is much better (figure 5). The negative impact of assimilation can be seen at almost all levels. We observe a negative bias of 1-2% at 850 hPa (figure 5). Figure 5: RMSE (left) and bias (right) for 850 hPa relative humidity forecasts (12 UTC). Assimilation experiment is in red. The opposite is true for wind speed, where we observe positive impact at almost all levels for the first 12 hours. Wind is also the quantity that we expect to improve the most with data assimilation in high resolution. Figure 6: RMSE of 00 UTC wind speed forecasts at 925 hPa (left) 12 UTC forecasts at 850 hPa (right). Assimilation experiment is in red. The surface scores agree on the major improvement of temperature scores at 2 m, as indicated by figure. Also relative humidity is a bit improved in the assimilation experiment. The strong and beneficial surface assimilation impact was observed also in previous surface assimilation (with Canari) experiments, so it is once again demonstrated here (figure 7). To conclude this section, the results are considered encouraging, especially for surface and wind analysis. The problem of humidity will have to be further investigated. Figure 7: RMSE of 00 UTC 2 m temperature forecasts (left) and 2 m relative humidity forecasts (right). Assimilation experiment is in red, operational suite (9 km) in blue. Parallel suite is not shown because of the error in climatological files during verification period. 3 Monitoring system LACE web-based monitoring suite (provided by HMS) was installed from the first export package. The installation was relatively smooth, one should modify a few lines in the script monitor_gmt.sh which draws figures in the GMT environment. Using the newest GMT version (4.5.0), arguments to pscoast function have slightly changed. 4 Solved problems and open questions 4.1 Solved problems Technical problems include corrections of bugs in reading B matrix (suejbbal.F90), correction for reading SEVIRI grib files (bator_decodgrib_mod.F90) and blacklisting on some kinds of data (mf_blacklist.b). Many solutions and help was provided by Gergely Boloni and Alena Trojakova. Some effort was also needed to create the assimilation namelists for cycle 35t1 with help of operational namelists from HMS and namelists of HARMONIE system (which are cy35t1). 4.2 Bator The ODB sub-bases are created in a loop over different observation types. The problem we experienced was that for a given observation type, there were no data inside our (relatively small) domain. The input OBSOUL file however was not empty, because data covered other parts of Europe. After none observation was selected by lamflag, there was a crash of bator which could not be avoided in advance (not knowing that there is no useful data). It seems that this type of crash can only be avoided by creating the whole ODB database at once, but this seems to be a less clear solution. 4.3 DFI We include digital filter initialization (DFI) in our first guess integrations and production runs. As warned by Piet Termonia, some correct high resolution features in the analysis increments could be removed by temporal filtering. We are planing to carry out some investigation of analysis spectra and if necessary, modify the critical timescale of the filter to allow some smaller scales to be present in the initial conditions. 5 Research areas 5.1 Surface albedo assimilation A study has been made (Jure Cedilnik) on how LandSAF products (albedo in particular) can be used to improve ALADIN forecasts. A simple Kalman filter based assimilation system (initially developed by Dominique Carrer, MF) was used to assimilate LandSAF albedo product in ALADIN. The albedo model values are considered constant in time (the model propagation matrix in Kalman filter is identity) and the observation vector is composed of the LandSAF albedo retrieval and a climatological value from ALADIN climatological file (providing some sort of a safeguard). There has been a six month verification performed and the results show some improvement for screen level model scores in winter/early spring months and neutral impact in summer part of the year. The next challenge is to use a similar Kalman filter based technique for the snow amount in the model by using the LandSAF snow cover product. 5.2 Research on B modeling Research on B modeling (Benedikt Strajnar) included the work on comparison and evaluation of B matrices, computed from ARPEGE assimilation ensemble (EnVar) with 6 members and ECMWF ensemble data assimilation experiment (EnDA) with control run (non-perturbed assimilation) and 20 members. The comparison period is July 2007. The ARPEGE ensembles were already downscaled to a 4 km domain described above. The next tasks will be to downscale ECMWF ensembles, to compute B matrices and to carry out some assimilation experiments for evaluation.
