Motion with a Constant Velocity
advertisement
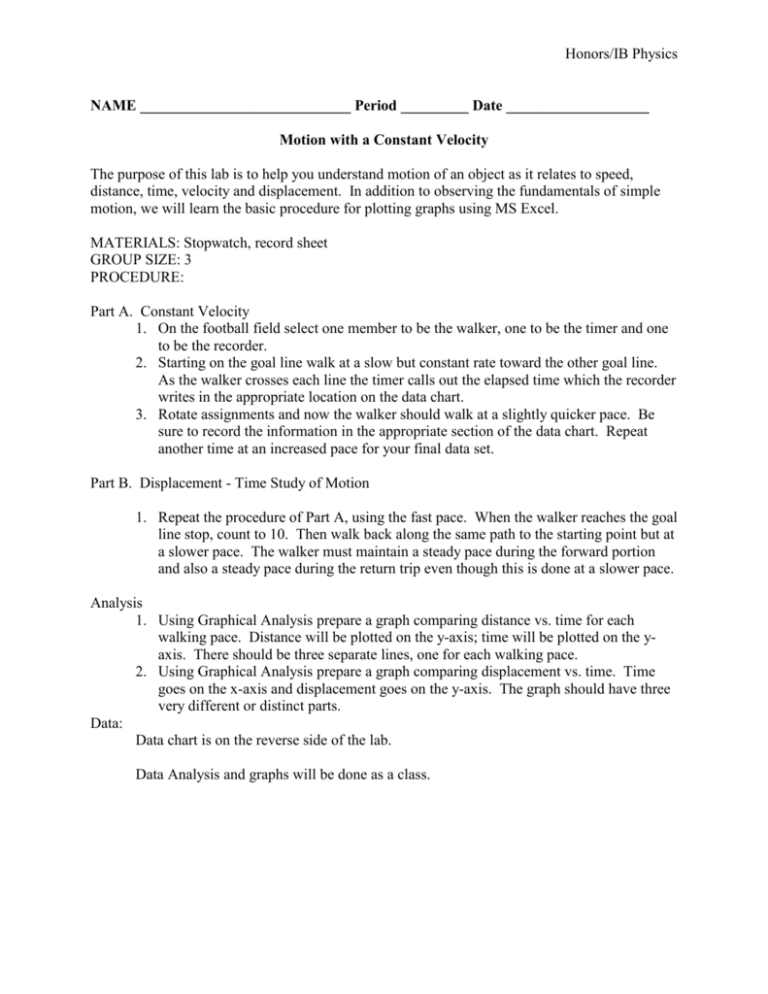
Honors/IB Physics NAME ____________________________ Period _________ Date ___________________ Motion with a Constant Velocity The purpose of this lab is to help you understand motion of an object as it relates to speed, distance, time, velocity and displacement. In addition to observing the fundamentals of simple motion, we will learn the basic procedure for plotting graphs using MS Excel. MATERIALS: Stopwatch, record sheet GROUP SIZE: 3 PROCEDURE: Part A. Constant Velocity 1. On the football field select one member to be the walker, one to be the timer and one to be the recorder. 2. Starting on the goal line walk at a slow but constant rate toward the other goal line. As the walker crosses each line the timer calls out the elapsed time which the recorder writes in the appropriate location on the data chart. 3. Rotate assignments and now the walker should walk at a slightly quicker pace. Be sure to record the information in the appropriate section of the data chart. Repeat another time at an increased pace for your final data set. Part B. Displacement - Time Study of Motion 1. Repeat the procedure of Part A, using the fast pace. When the walker reaches the goal line stop, count to 10. Then walk back along the same path to the starting point but at a slower pace. The walker must maintain a steady pace during the forward portion and also a steady pace during the return trip even though this is done at a slower pace. Analysis 1. Using Graphical Analysis prepare a graph comparing distance vs. time for each walking pace. Distance will be plotted on the y-axis; time will be plotted on the yaxis. There should be three separate lines, one for each walking pace. 2. Using Graphical Analysis prepare a graph comparing displacement vs. time. Time goes on the x-axis and displacement goes on the y-axis. The graph should have three very different or distinct parts. Data: Data chart is on the reverse side of the lab. Data Analysis and graphs will be done as a class. Honors/IB Physics Part A Distance (yards) 0 5 10 15 20 25 30 35 40 45 50 55 60 65 70 75 80 85 90 95 100 Time (s) slow pace Time (s) normal pace Time (s) fast pace Honors/IB Physics Part B Displacement (yards) 0 5 10 15 20 25 30 35 40 45 50 55 60 65 70 75 80 85 90 95 100 Restart 95 90 85 80 75 70 65 60 55 50 45 40 35 30 25 20 15 10 5 0 Time (s) Honors/IB Physics CONCLUSIONS/QUESTIONS PART A 1. What is the value of the slope of the line for each of the walking paces in Part A? Slow: ____________________ Normal:__________________ Fast:_____________________ 2. What are the units of this slope? _____________ 3. What does the slope indicate? ________________________________________________________________ 4. How are the slopes of the lines related to the walking pace in each trial? ___________________________________________________________________________ ___________________________________________________________________________ PART B 7. What is the slope of the forward trip in Part B? _____________________ 8. What is the slope of the graph for the STOP interval? ________________ 9. What is the value of the slope for the return trip? ____________________ 10.What is the algebraic sign of the slope in the return trip? _____________ 11.What is the physical meaning of this sign? _________________________ ________________________________________________________________ ________________________________________________________________ 12.Distinguish between displacement and distance. _____________________ ________________________________________________________________ ________________________________________________________________ 13. What was the total amount of time for the trip? ____________________ 14. What was the total distance for the trip? ___________________________ 15. What was the average speed for the trip? __________________________ 16. What was the total displacement for the trip? _______________________ Honors/IB Physics Additional Questions: 17. Evaluate the precision of your data for each of the three different paces for Part A. 18. What would your distance vs. time graph for Part A look like if you started out walking very slowly and gradually increased your speed as you traveled across the field? Sketch a rough graph below. 19. Sketch a velocity vs. time graph for the three paces from Part A.
