Is Wine Good for Your Heart
advertisement
COMPARING TWO DRUGS (Illustrative Report)
Marg Innovera
Purpose
To determine whether a generic drug and reference drug differ in their biological absorption.
Method
A cross-over trail with a washout period separating two drugs was used to look at absorption of brand name drug
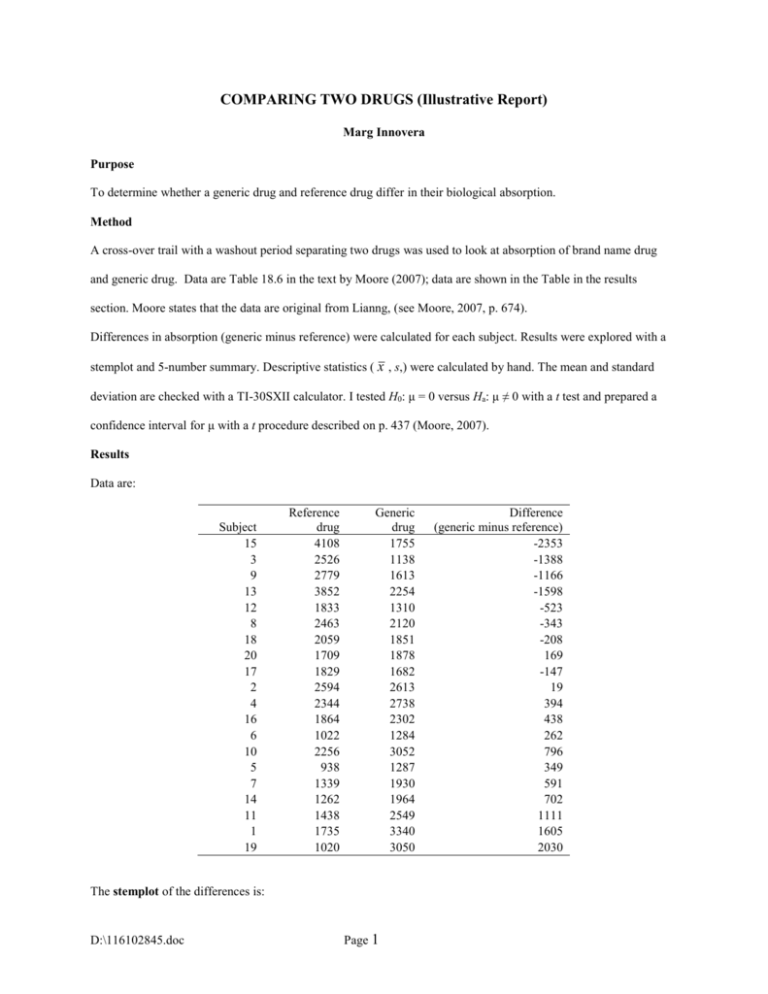
and generic drug. Data are Table 18.6 in the text by Moore (2007); data are shown in the Table in the results
section. Moore states that the data are original from Lianng, (see Moore, 2007, p. 674).
Differences in absorption (generic minus reference) were calculated for each subject. Results were explored with a
stemplot and 5-number summary. Descriptive statistics ( x , s,) were calculated by hand. The mean and standard
deviation are checked with a TI-30SXII calculator. I tested H0: μ = 0 versus Ha: μ ≠ 0 with a t test and prepared a
confidence interval for μ with a t procedure described on p. 437 (Moore, 2007).
Results
Data are:
Subject
15
3
9
13
12
8
18
20
17
2
4
16
6
10
5
7
14
11
1
19
Reference
drug
4108
2526
2779
3852
1833
2463
2059
1709
1829
2594
2344
1864
1022
2256
938
1339
1262
1438
1735
1020
Generic
drug
1755
1138
1613
2254
1310
2120
1851
1878
1682
2613
2738
2302
1284
3052
1287
1930
1964
2549
3340
3050
The stemplot of the differences is:
D:\116102845.doc
Page 1
Difference
(generic minus reference)
-2353
-1388
-1166
-1598
-523
-343
-208
169
-147
19
394
438
262
796
349
591
702
1111
1605
2030
-2|3
-1|5
-1|31
-0|5
-0|321
0|012334
0|577
1|1
1|6
2|0
(X 1000)
The stemplot of observed differences is mound-shaped with no major departures from Normality and has no
apparent outliers. The median is about 200, and data spread from about -2300 to 2000.
The ordered array is {-2353, -1598, -1388, -1166, -523, -343, -208, -147, 19, 169, 262, 349, 394, 438, 591, 702, 796,
1111, 1605, 2030}. The 5 point summary is: -2353, -433, 215.5, 646.5, 2030.
The mean x = 37 and standard deviation are s = 1070.6 based n = 20 subjects.
The 95% confidence interval for μ = x ± (t*)(s /√n) = 37 ± (2.093)(1070.6 / √20) = 37 ± 501 = (−464 to 538).
The hypothesis test is A. Hypotheses. H0: μ = 0 versus Ha: μ ≠ 0; B. Test statistic. SE = 1070.6 / √20 = 239.39; tstat =
37 / 239.39 = 0.15 with df = 20 – 1 = 19; C. P-value. Using Table C, the two-sided P > 0.5; D. The evidence against
the null hypothesis is not significant.
Discussion
Although there was a lot of variation in absorption, the mean difference was not significant (P > .5). However, the
confidence interval for the mean difference if -464 to 538, showing our estimate to be imprecise.
References
Moore, D.S. (2007). The Basic Practice of Statistics (4th ed.). New York: Freeman.
Lianng, Y. (personal communication, date unknown). Cited on p. 674 of Moore, 2007.
D:\116102845.doc
Page 2

