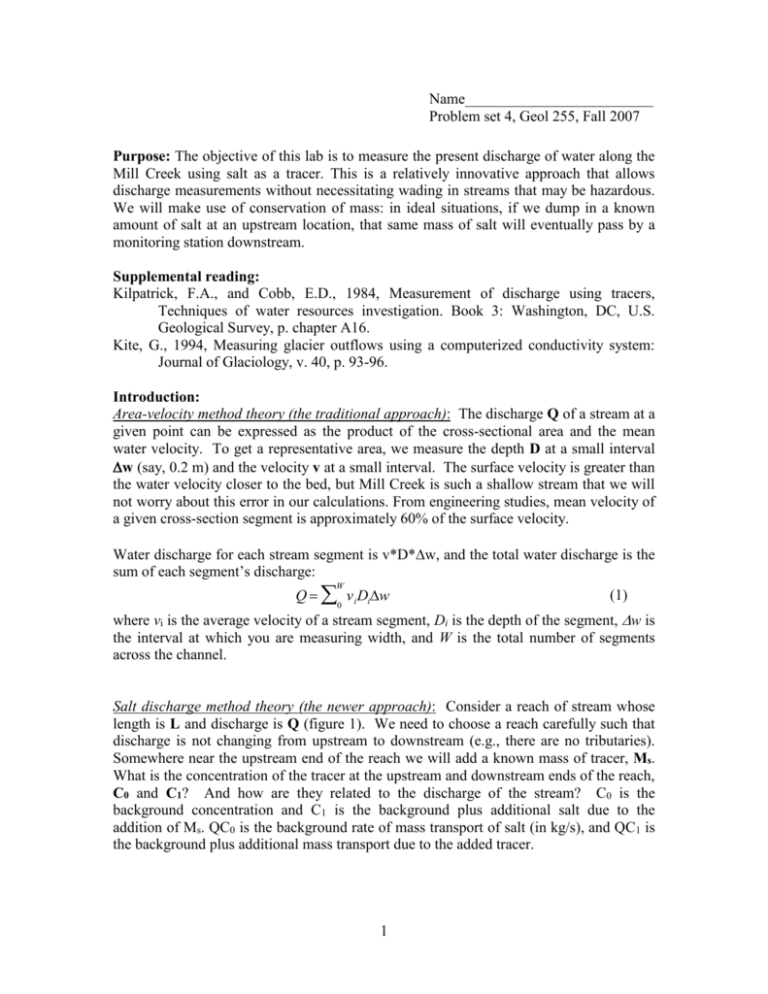
Figure 1 - Cloudfront.net
advertisement

Name_________________________ Problem set 4, Geol 255, Fall 2007 Purpose: The objective of this lab is to measure the present discharge of water along the Mill Creek using salt as a tracer. This is a relatively innovative approach that allows discharge measurements without necessitating wading in streams that may be hazardous. We will make use of conservation of mass: in ideal situations, if we dump in a known amount of salt at an upstream location, that same mass of salt will eventually pass by a monitoring station downstream. Supplemental reading: Kilpatrick, F.A., and Cobb, E.D., 1984, Measurement of discharge using tracers, Techniques of water resources investigation. Book 3: Washington, DC, U.S. Geological Survey, p. chapter A16. Kite, G., 1994, Measuring glacier outflows using a computerized conductivity system: Journal of Glaciology, v. 40, p. 93-96. Introduction: Area-velocity method theory (the traditional approach): The discharge Q of a stream at a given point can be expressed as the product of the cross-sectional area and the mean water velocity. To get a representative area, we measure the depth D at a small interval w (say, 0.2 m) and the velocity v at a small interval. The surface velocity is greater than the water velocity closer to the bed, but Mill Creek is such a shallow stream that we will not worry about this error in our calculations. From engineering studies, mean velocity of a given cross-section segment is approximately 60% of the surface velocity. Water discharge for each stream segment is v*D*w, and the total water discharge is the sum of each segment’s discharge: Q v i Diw W 0 (1) where vi is the average velocity of a stream segment, Di is the depth of the segment, w is the interval at which you are measuring width, and W is the total number of segments across the channel. Salt discharge method theory (the newer approach): Consider a reach of stream whose length is L and discharge is Q (figure 1). We need to choose a reach carefully such that discharge is not changing from upstream to downstream (e.g., there are no tributaries). Somewhere near the upstream end of the reach we will add a known mass of tracer, Ms. What is the concentration of the tracer at the upstream and downstream ends of the reach, C0 and C1? And how are they related to the discharge of the stream? C0 is the background concentration and C1 is the background plus additional salt due to the addition of Ms. QC0 is the background rate of mass transport of salt (in kg/s), and QC1 is the background plus additional mass transport due to the added tracer. 1 Figure 1 We make use of the fact that we have chosen the tracer wisely, such that it does not adsorb to the surfaces of sediment in the bed or in the flow, that it does not chemically react in any way over the reach; in other words, it is a conservative tracer (its properties are conserved through the reach). We also assume that it is rapidly mixed throughout the water column both vertically and laterally, so that at any point along the river a sample of the water anywhere in the cross-section will yield the same concentration. Note that this dictates that L be several flow widths downstream of the injection point of the tracer. In fact, a good rule of thumb is that L be 10-20 times the width of the flow. We now make the following word statement of mass conservation, followed by its mathematical analog: The mass of tracer coming into the reach naturally, plus the mass of tracer added to it equals the mass leaving the reach. QC t M QC t T 0 T 0 s 0 1 (2) The area under the QC1 curve is the total mass of salt transported over our observations, and the area between QC1 and QC0 is Ms (figure 2). In math-speak, this is M s QC1t QC 0t T T 0 0 2 (3) Figure 2 We can simplify equation 3 by combining terms on the right side of the equation, to yield this equation: M s Q C1 C0 t T 0 (4) In practice, we actually measure electrical conductivity E, a proxy for concentration. Therefore, we need one more step: converting concentration to conductivity using a conversion factor F,typically in the range of 1890 (µS/cm)/(kg/m3). Since this is a constant, we can factor this out of the right side of equation 4, as follows: Q T (5) M s E1 E 0 t F 0 Finally, rearrange the equation to solve for Q: M sF Q T E1 E 0 t (6) 0 Let’s check our units. Discharge is in m3/s, so we need to make sure that the right side of the equation is also in m3/s. Since Ms is in kg, F is in (µS/cm)/(kg/m3), E is in µS/cm and kg* (S /cm) t is in s, the units on the right side of the equation are , which (S /cm) * s * (kg/m 3 ) simplifies to m3/s. That’s what we want! This is the equation behind what is known as the slug injection tracer-dilution method of estimating stream discharge. We can measure stream discharge by adding a known amount of tracer, Ms, and by measuring the concentrations of this tracer downstream of the reach of concern. The value of E0 is the background electrical conductivity one measures before injecting the tracer, and to which the conductivity must return before the end of the experiment – i.e., the time it takes to return to the background is the experiment time T. There are several variants on this theme of measuring discharge with tracers. Not only are there a variety of tracers, but the timing or history of the addition of tracer varies. The one described above is the slug test, which involves simply dumping in a known quantity 3 of tracer at one moment. The result downstream is a smeared out pulse of tracer concentration. The further downstream it is measured, the longer the pulse takes to get there, and the more smeared out it appears on a plot of concentration vs. time (see Figure 3). Figure 3 Note that one very quick thing we can extract from such a plot is the mean speed of the water between the injection point and the point of measurement, derived from knowing the distance between points, and the time elapsed between the time of injection and the time of arrival of the peak in the concentration. Exercises: 1. Measure water discharge using the salt discharge method at 2 different locations. 2. Measure the along-channel distance from the salt-input site to each measurement site. 3. Measure water discharge using the area-velocity method. Deliverables: 1. Plot of conductivity over time for one of the sites, including your determination of ‘area under the curve’ (3 pts.) 2. Your calculation of water discharge for your one site using the salt discharge method (2 pts.) 3. Average water velocity from the salt-input site to EACH measurement location. Hint: look at Figure 2 and the associated text for guidance. (2 pts.) 4 4. A short (~1 paragraph) comparison of the area-velocity discharge from one of the sites and the salt-tracer discharge calculated in Deliverable 2. Include potential sources of error for the salt-tracer method and for the area-velocity method. (3 pts.) 5


