Supplementary material S2
advertisement
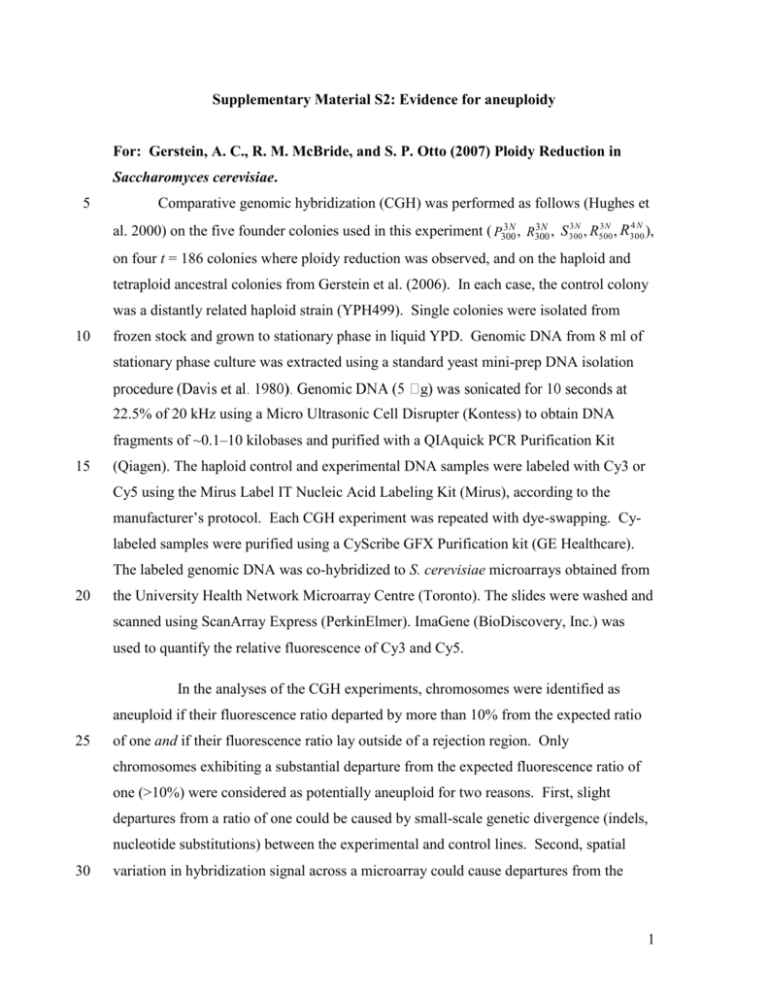
Supplementary Material S2: Evidence for aneuploidy For: Gerstein, A. C., R. M. McBride, and S. P. Otto (2007) Ploidy Reduction in Saccharomyces cerevisiae. 5 Comparative genomic hybridization (CGH) was performed as follows (Hughes et 4N 3N 3N 3N 3N al. 2000) on the five founder colonies used in this experiment ( P300 , R300 , S 300 , R500 , R300 ), on four t = 186 colonies where ploidy reduction was observed, and on the haploid and tetraploid ancestral colonies from Gerstein et al. (2006). each case, the control colony In was a distantly related haploid strain (YPH499). Single colonies were isolated from 10 frozen stock and grown to stationary phase in liquid YPD. Genomic DNA from 8 ml of stationary phase culture was extracted using a standard yeast mini-prep DNA isolation 22.5% of 20 kHz using a Micro Ultrasonic Cell Disrupter (Kontess) to obtain DNA fragments of ~0.1–10 kilobases and purified with a QIAquick PCR Purification Kit 15 (Qiagen). The haploid control and experimental DNA samples were labeled with Cy3 or Cy5 using the Mirus Label IT Nucleic Acid Labeling Kit (Mirus), according to the manufacturer’s protocol. Each CGH experiment was repeated with dye-swapping. Cylabeled samples were purified using a CyScribe GFX Purification kit (GE Healthcare). The labeled genomic DNA was co-hybridized to S. cerevisiae microarrays obtained from 20 the University Health Network Microarray Centre (Toronto). The slides were washed and scanned using ScanArray Express (PerkinElmer). ImaGene (BioDiscovery, Inc.) was used to quantify the relative fluorescence of Cy3 and Cy5. In the analyses of the CGH experiments, chromosomes were identified as aneuploid if their fluorescence ratio departed by more than 10% from the expected ratio 25 of one and if their fluorescence ratio lay outside of a rejection region. Only chromosomes exhibiting a substantial departure from the expected fluorescence ratio of one (>10%) were considered as potentially aneuploid for two reasons. First, slight departures from a ratio of one could be caused by small-scale genetic divergence (indels, nucleotide substitutions) between the experimental and control lines. Second, spatial 30 variation in hybridization signal across a microarray could cause departures from the 1 expected ratio of one, because the oligonucleotide sequences were arrayed non-randomly on the microarrays obtained from the University Health Network Microarray Centre (Toronto), with clustering of sequences from the same chromosomes (see Gerstein et al. 2006). 5 In addition, a rejection region was constructed to identify chromosomes exhibiting statistically significant evidence of aneuploidy by adding t 0.0016,15 SE pooled to the expected log-fluorescence of zero. Because a standard error ( SE ) based on two microarrays is subject to substantial error, a pooled standard error ( SE pooled ) was calculated by taking the pooled sample variance across all16 chromosomes (as measured 10 by the mean-squared error), dividing by n = 2, and taking the square-root. A critical value of 0.0016 was used for the t-statistic to correct for the 16 chromosomal comparisons made per genome (Dunn- idák correction; Sokal and Rohlf ); 95% of such rejection regions would contain all chromosomes under the null hypothesis of euploidy. A sequential method (Rice 1989) was used to detect aneuploid chromosomes, 15 whereby we eliminated the data from the chromosome exhibiting the greatest evidence for aneuploidy, adjusted the fluorescence ratios and the t-statistic, and reevaluated the remaining chromosomes until none met our criteria for aneuploidy. References 20 Davis, R.W., M. Thomas, J. Cameron, T.P.S. John, S. Scherer, R.A. Padgett (1980) Rapid DNA isolation for enzymatic and hybridization analysis. Methods Enzymol 65:404-411 Gerstein, A.C., H.E. Chun, A. Grant, S.P. Otto (2006). Genomic convergence toward diploidy in Saccharomyces cerevisiae. PLoS Genetics 2: e145 25 Rice W. R. 1989. Analyzing tables of statistical tests. Evolution. 43: 223–225. Sokal, R. R. and F. J. Rohlf. 1995. Biometry: the principles and practice of statistics in biological research. 3rd edition. W. H. Freeman and Co. New York. 2
