6.SP.B.4 Lesson Creating Box Plots
advertisement

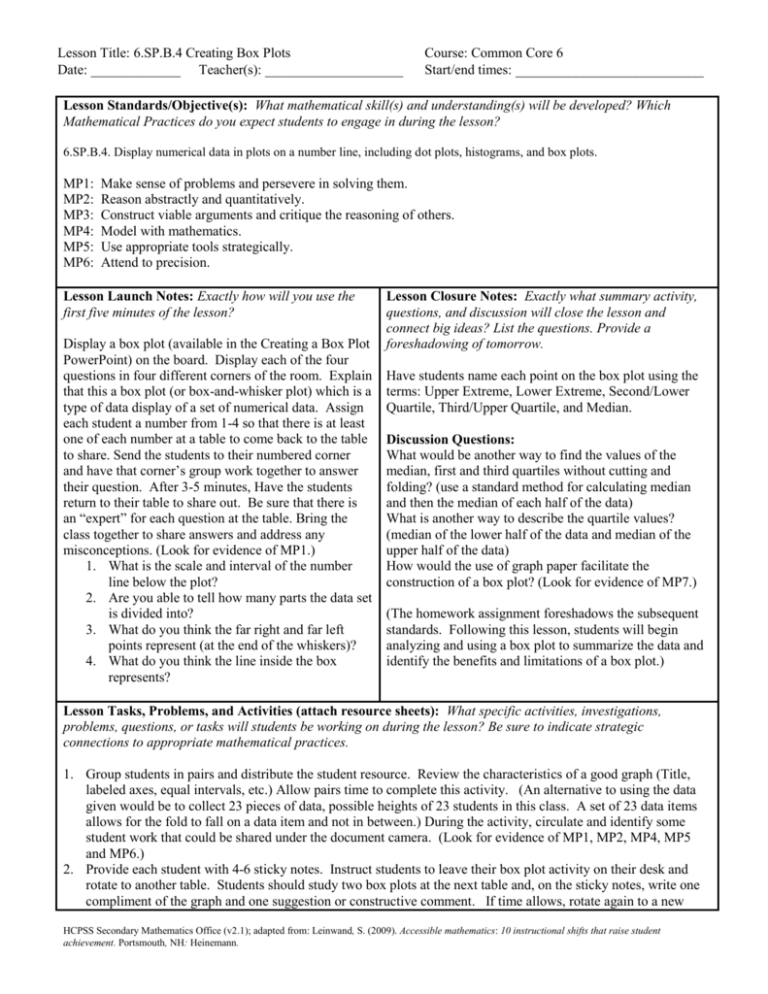
Lesson Title: 6.SP.B.4 Creating Box Plots Date: _____________ Teacher(s): ____________________ Course: Common Core 6 Start/end times: _________________________ Lesson Standards/Objective(s): What mathematical skill(s) and understanding(s) will be developed? Which Mathematical Practices do you expect students to engage in during the lesson? 6.SP.B.4. Display numerical data in plots on a number line, including dot plots, histograms, and box plots. MP1: MP2: MP3: MP4: MP5: MP6: Make sense of problems and persevere in solving them. Reason abstractly and quantitatively. Construct viable arguments and critique the reasoning of others. Model with mathematics. Use appropriate tools strategically. Attend to precision. Lesson Launch Notes: Exactly how will you use the first five minutes of the lesson? Display a box plot (available in the Creating a Box Plot PowerPoint) on the board. Display each of the four questions in four different corners of the room. Explain that this a box plot (or box-and-whisker plot) which is a type of data display of a set of numerical data. Assign each student a number from 1-4 so that there is at least one of each number at a table to come back to the table to share. Send the students to their numbered corner and have that corner’s group work together to answer their question. After 3-5 minutes, Have the students return to their table to share out. Be sure that there is an “expert” for each question at the table. Bring the class together to share answers and address any misconceptions. (Look for evidence of MP1.) 1. What is the scale and interval of the number line below the plot? 2. Are you able to tell how many parts the data set is divided into? 3. What do you think the far right and far left points represent (at the end of the whiskers)? 4. What do you think the line inside the box represents? Lesson Closure Notes: Exactly what summary activity, questions, and discussion will close the lesson and connect big ideas? List the questions. Provide a foreshadowing of tomorrow. Have students name each point on the box plot using the terms: Upper Extreme, Lower Extreme, Second/Lower Quartile, Third/Upper Quartile, and Median. Discussion Questions: What would be another way to find the values of the median, first and third quartiles without cutting and folding? (use a standard method for calculating median and then the median of each half of the data) What is another way to describe the quartile values? (median of the lower half of the data and median of the upper half of the data) How would the use of graph paper facilitate the construction of a box plot? (Look for evidence of MP7.) (The homework assignment foreshadows the subsequent standards. Following this lesson, students will begin analyzing and using a box plot to summarize the data and identify the benefits and limitations of a box plot.) Lesson Tasks, Problems, and Activities (attach resource sheets): What specific activities, investigations, problems, questions, or tasks will students be working on during the lesson? Be sure to indicate strategic connections to appropriate mathematical practices. 1. Group students in pairs and distribute the student resource. Review the characteristics of a good graph (Title, labeled axes, equal intervals, etc.) Allow pairs time to complete this activity. (An alternative to using the data given would be to collect 23 pieces of data, possible heights of 23 students in this class. A set of 23 data items allows for the fold to fall on a data item and not in between.) During the activity, circulate and identify some student work that could be shared under the document camera. (Look for evidence of MP1, MP2, MP4, MP5 and MP6.) 2. Provide each student with 4-6 sticky notes. Instruct students to leave their box plot activity on their desk and rotate to another table. Students should study two box plots at the next table and, on the sticky notes, write one compliment of the graph and one suggestion or constructive comment. If time allows, rotate again to a new HCPSS Secondary Mathematics Office (v2.1); adapted from: Leinwand, S. (2009). Accessible mathematics: 10 instructional shifts that raise student achievement. Portsmouth, NH: Heinemann. Lesson Title: 6.SP.B.4 Creating Box Plots Course: Common Core 6 Date: _____________ Teacher(s): ____________________ Start/end times: _________________________ table and repeat this process. (Look for evidence of MP3.) 3. Provide students time to make adjustments or corrections to their own box plots. 4. Project exemplary box plots (identified by teacher in step 1) and discuss as a class. Request volunteers to share their box plot for critique by the class. Have student focus on accurate components of the graph (title, labeled axis, equal intervals, neatly drawn boxes, etc.) (Look for evidence of MP3.) Evidence of Success: What exactly do I expect students to be able to do by the end of the lesson, and how will I measure student success? That is, deliberate consideration of what performances will convince you (and any outside observer) that your students have developed a deepened and conceptual understanding. Students will be able to identify the points on the lesson launch box plot (median and extremes). Students will be able to recognize that they are finding the median and quartiles when ordering and folding the data strip. Students will be able to recognize that the median does not have to cut the box in the center. Evidence of this will be demonstrated by the students’ accurately constructed box plots; students ability to critique their peers’ work, and responses to closure discussion questions. Notes and Nuances: Vocabulary, connections, anticipated misconceptions (and how they will be addressed), etc. Vocabulary: Median, Extremes, Quartiles Connections: Refer back to components of a complete graph. (Title, Labels, Appropriate scale and intervals) Anticipated misconceptions: Students think that the median must fall at the center of the box. Students may think that the box and whiskers are drawn on the number line rather than above the number line. Resources: What materials or resources are essential for students to successfully complete the lesson tasks or activities? Homework: Exactly what follow-up homework tasks, problems, and/or exercises will be assigned upon the completion of the lesson? Printed copies of the 4 corners questions (in Creating a Box Plot PowerPoint resource) Copies of Student Resource sheet Rulers Using the box plot (without the original raw data), write 35 sentences summarizing the data displayed. (These summaries can be used to identify misconceptions and launch a discussion leading into analyzing box plots.) Lesson Reflections: How do you know that you were effective? What questions, connected to the lesson standards/objectives and evidence of success, will you use to reflect on the effectiveness of this lesson? Did students show an understanding that the data is divided into fourths? Did students transfer previous knowledge of parts of a graph? Were students able to generate an appropriate title for the graph and label for the number line? Are students ready to have the discussion of benefits and limitations of a box plot (shows the shape and clustering of the data but not a mean, specific data points or size of the data sample)? Howard County Public Schools Office of Secondary Mathematics Curricular Projects has licensed this product under a Creative Commons Attribution-NonCommercial-NoDerivs 3.0 Unported License. HCPSS Secondary Mathematics Office (v2.1); adapted from: Leinwand, S. (2009). Accessible mathematics: 10 instructional shifts that raise student achievement. Portsmouth, NH: Heinemann.


