Figures
advertisement
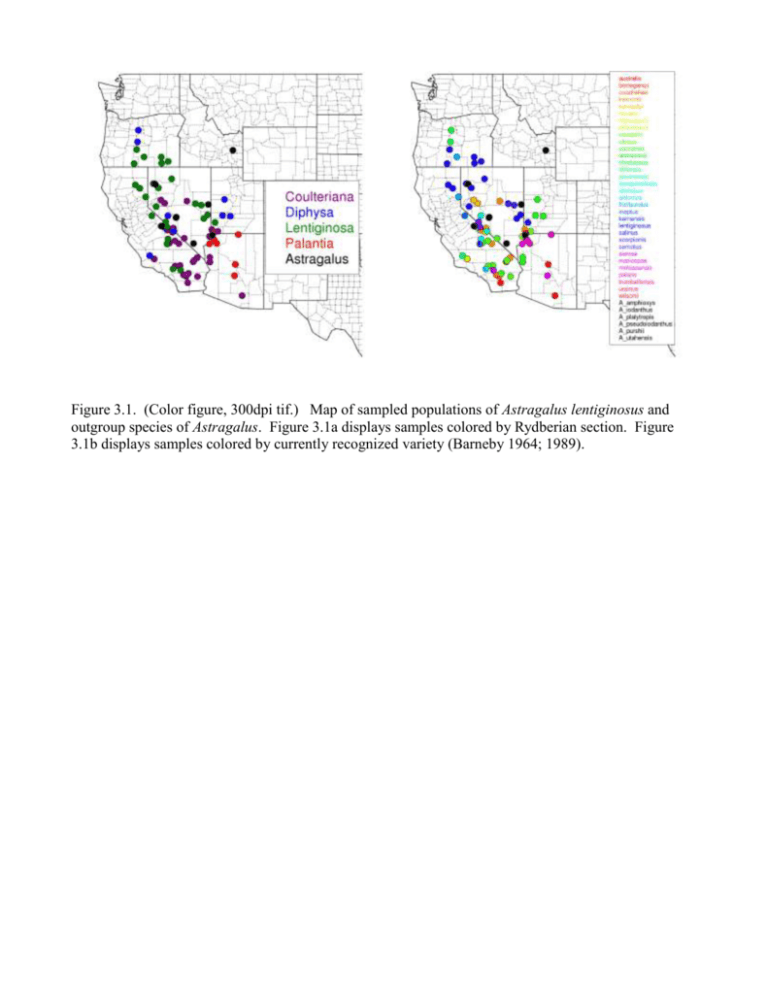
Figure 3.1. (Color figure, 300dpi tif.) Map of sampled populations of Astragalus lentiginosus and outgroup species of Astragalus. Figure 3.1a displays samples colored by Rydberian section. Figure 3.1b displays samples colored by currently recognized variety (Barneby 1964; 1989). Figure 3.2. (Color figure, 300dpi tif.) Histograms of allele distribution per marker. The marker ccmp10 shows a pattern that is not representative of a mononucleotide repeat, but of a compound indel. The marker trnTL839f shows an anomolously small allele at 285 base pairs. Figure 3.2f shows haplotypes on the x-axis which are unordered. Figure 3.3. (Color figure, 300 dpi tif.) Neighbor-joining dendrogram based on a pairwise distance. Figure 3.4. (Color figure, 300 dpi tif.) Convergence diagnostics for Bayesian hierarchical spatial analysis. Figure 3.4a plots nuber of groups by MCMC iteration. Figure 3.4b is a histogram plotting density of number of groups. Figure 3.5. (Color figure, 300 dpi tif.) Barplot of group membership based on Bayesian hierarchichal analysis. Each vertical bar represents a sampled individual. Color of bars corresponds to posterior probability of group membership. Rectangles above 1.0 represent taxonomic hypotheses. The top row represents Rydbergian sections, colors follow figure 3.1a. The row second from the top represents varieties, colors follow figure 3.3. Figure 3.6. (Color figure, 300 dpi tif.) Plots of posterior probability of membership to each of seven classes. Color of points follow figure 3.1a. Probability of group membership ranges from zero (red) to one (white). The x-axis is longitude while the y-axis is latitude.
