Comments on eqn - Royal Society of Chemistry
advertisement
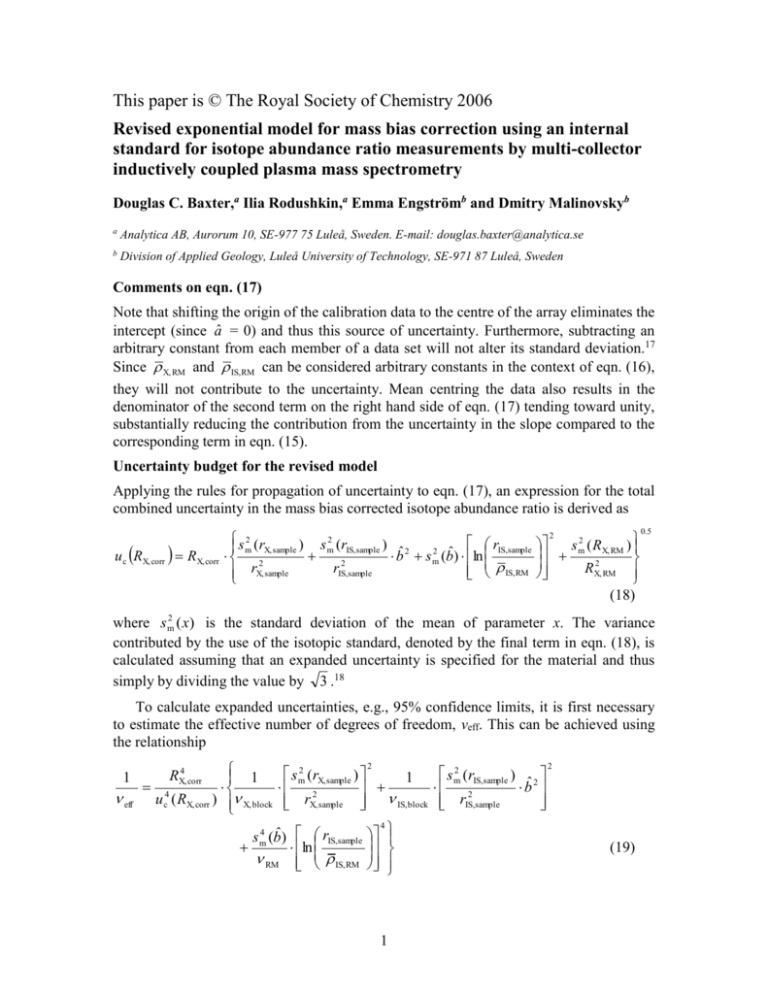
This paper is © The Royal Society of Chemistry 2006 Revised exponential model for mass bias correction using an internal standard for isotope abundance ratio measurements by multi-collector inductively coupled plasma mass spectrometry Douglas C. Baxter,a Ilia Rodushkin,a Emma Engströmb and Dmitry Malinovskyb a Analytica AB, Aurorum 10, SE-977 75 Luleå, Sweden. E-mail: douglas.baxter@analytica.se b Division of Applied Geology, Luleå University of Technology, SE-971 87 Luleå, Sweden Comments on eqn. (17) Note that shifting the origin of the calibration data to the centre of the array eliminates the intercept (since â = 0) and thus this source of uncertainty. Furthermore, subtracting an arbitrary constant from each member of a data set will not alter its standard deviation.17 Since X, RM and IS,RM can be considered arbitrary constants in the context of eqn. (16), they will not contribute to the uncertainty. Mean centring the data also results in the denominator of the second term on the right hand side of eqn. (17) tending toward unity, substantially reducing the contribution from the uncertainty in the slope compared to the corresponding term in eqn. (15). Uncertainty budget for the revised model Applying the rules for propagation of uncertainty to eqn. (17), an expression for the total combined uncertainty in the mass bias corrected isotope abundance ratio is derived as u c RX, corr RX, corr 2 s 2 (r rIS,sample m X, sample ) s m (rIS,sample ) ˆ 2 2 b s m2 (bˆ) ln 2 r rIS,sample IS, RM X, sample s 2 (R ) m X, RM RX,2 RM (18) 2 0.5 where s m2 ( x) is the standard deviation of the mean of parameter x. The variance contributed by the use of the isotopic standard, denoted by the final term in eqn. (18), is calculated assuming that an expanded uncertainty is specified for the material and thus simply by dividing the value by 3 .18 To calculate expanded uncertainties, e.g., 95% confidence limits, it is first necessary to estimate the effective number of degrees of freedom, νeff. This can be achieved using the relationship 1 eff 1 4 u c ( RX, corr ) X, block RX,4 corr 2 s m2 (rX, sample ) 1 2 rX, sample IS, block s 4 (bˆ) rIS,sample m ln RM IS, RM 4 1 s m2 (rIS,sample ) 2 bˆ 2 rIS,sample 2 (19) where νX/IS,block and νRM are the degrees of freedom associated with the number of blocks of data measured for each isotopic standard containing IS (i.e., mX/IS,block – 1) and with the regression analysis (i.e., nRM – 1, where nRM is the number of replicate analyses of the isotopic standard performed during the measurement session), respectively. There is no need to include the term for the reference material here, since it can be assumed to have an infinite number of degrees of freedom.18 The computed νeff is utilized to find the appropriate t-value (two-tailed) for calculating the expanded uncertainty, U, where U = tּuc(RX,corr) (20) -values A common means to express the results of isotope abundance ratio measurements is as values, defined as r RX, corr X, sample 1 1000‰ X, RM RX, RM bˆ 1 1000‰ IS, RM r IS,sample (21) where the second form is obtained by substituting for RX,corr from eqn. (17), thus eliminating RX,RM from the expression. Consequently, the uncertainty in the composition of the isotopic standard does not contribute to that of the determined -value at all 2 s 2 (r rIS,sample m X, sample ) s m (rIS,sample ) ˆ 2 u c b s m2 (bˆ) ln 2 2 r rIS,sample IS, RM X, sample 2 0.5 1000‰ (22) a result that has been widely used in the past, albeit without theoretical justification. As before, it is necessary to compute the effective number of degrees of freedom 1 1012 1 4 eff ( ) u c ( ) X, block 2 s m2 (rX, sample ) 1 2 rX, sample IS, block s 4 (bˆ) rIS,sample m ln RM IS, RM 4 s m2 (rIS,sample ) 2 bˆ 2 r IS,sample 2 (23) in order to derive the expanded uncertainty, in this case in the -value U() = tּuc() (24) References 17. J. C. Miller and J. N. Miller, Statistics for Analytical Chemists, 2nd ed., Ellis Horwood, Chichester, 1988, p 70. 18. EURACHEM/CITAC Guide CG 4. Quantifying Uncertainty in Analytical Measurement, 2nd ed., Laboratory of the Government Chemist, London, 2000. 2
