Supplementary Information
advertisement
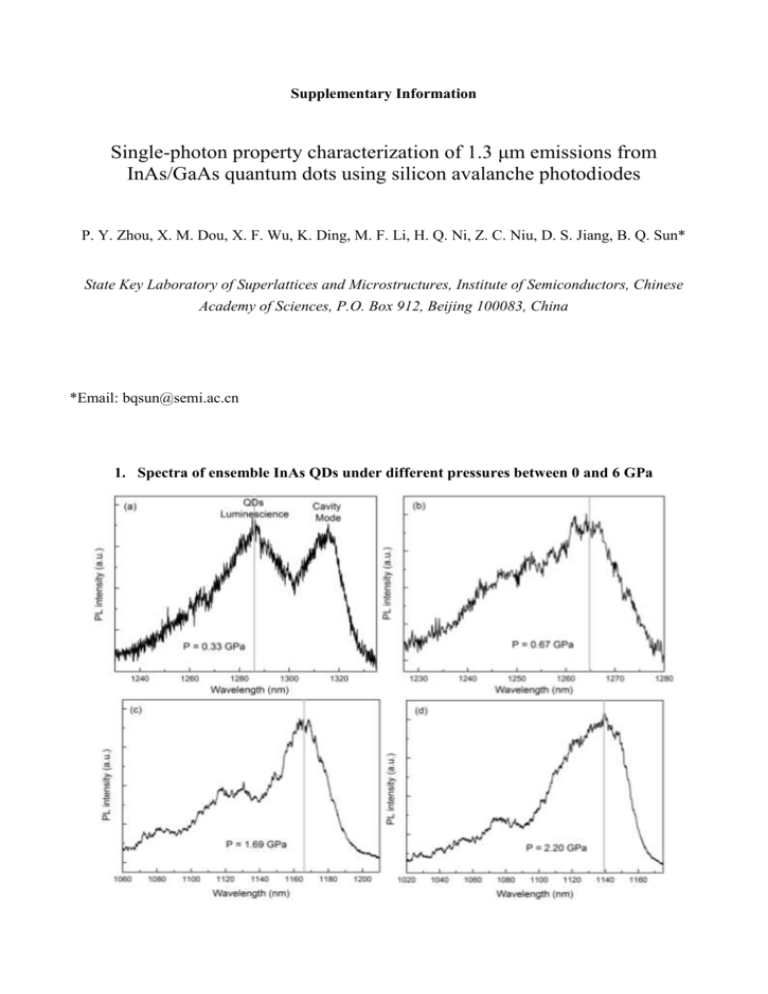
Supplementary Information Single-photon property characterization of 1.3 μm emissions from InAs/GaAs quantum dots using silicon avalanche photodiodes P. Y. Zhou, X. M. Dou, X. F. Wu, K. Ding, M. F. Li, H. Q. Ni, Z. C. Niu, D. S. Jiang, B. Q. Sun* State Key Laboratory of Superlattices and Microstructures, Institute of Semiconductors, Chinese Academy of Sciences, P.O. Box 912, Beijing 100083, China *Email: bqsun@semi.ac.cn 1. Spectra of ensemble InAs QDs under different pressures between 0 and 6 GPa Figure S1. (a)-(g) PL spectra of 1.3 μm ensemble QDs under different pressures from 0 to 6 GPa. The grey line in each graph indicates the luminescence peak we traced. 2. Setup response function for the time-resolved measurements using silicon APD Figure S2. Setup response function (SRF) for the time-resolved measurements using silicon APD (black line) and a 63 ps laser pulse diode. The setup resolution was obtained from the full width at half maximum (FWHM) of the SRF, which is approximately 0.4 ns. 3. The lifetime of InAs QDs luminescence under different pressure Figure S3. Lifetime of InAs QDs (with 0.9 μm emissions at 0 GPa and without cavity) under different pressure from 0 to 3.25 GPa. 4. Setup response function for the time-resolved measurements using InGaAs APD Figure S4. SRF for the time-resolved measurements using InGaAs APD (black line). The setup resolution, obtained from the FWHM of the SRF, is approximately 0.44 ns. Due to the mismatch between the wavelength (640 nm, 63 ps pulses) of diode laser (used to excite QDs) and the InGaAs APD spectral response range, the setup resolution was measured using a mode-locked Ti:sapphire laser with a width of ~0.1 ps pulses, and a wavelength of 980 nm. 5. Row data, background and correlation results of the g(2)(τ) measurements of a single InAs QD at 0 GPa Figure S5. Raw data, background and correlation results of the g(2)(τ) measurements for a single InAs QD with 1331.9 nm emission line mentioned in the text under the condition of the dead time of the used InGaAs APDs set to 1 (a) or 10 μs (b), respectively. The correlation results were obtained by subtracting background from the raw data. 6. Spectra and g(2)(τ) measurements of a single QD (with ~900 nm emission at 0 GPa) under different pressure from 0 to 3 GPa Figure S6. (a)-(e) PL spectra of a single InAs QD (with ~900 nm emission line at 0 GPa) under pressures of 0.85, 1.37, 1.72, 1.23 and 3.10 GPa, respectively, at 4 K; the inner panels are the corresponding g(2)(τ) measurement results, red lines are fitting curve obtained from the similar simulation of Reference (1). To gain insight on how the pressure conditions affect the single-photon property of InAs QDs, and to verify the new approach proposed more convincingly, we used a pressure device which can be adjusted continuously among ~3 GPa range using a piezoelectric ceramic at low temperature, monitored the QD PL spectra and the g(2)(τ) measurement evolution, where the QD emission line at 0 GPa is ~900 nm. Figures S5 (a)-(e) present the PL spectra and g(2)(τ) results obtained at five different pressures. From these measurements it can be seen that, although the PL emission peak shifts to the shorter wavelength, all g(2)(0) values are smaller than 0.3, indicating it remains the single-photon emission under pressure. (1) Nakajima, H.; Kumano, H.; Iijima, H.; Suemune, I. Appl. Phys. Lett. 2012, 101, 161107.


