details
advertisement
Detection of putatitve binding sites
Our implementation to detect putative binding sites follows the use of position
weight matrices as previously described (Berg and von Hippel, 1987; Stormo and Fields,
1998) with only minor modifications.
Motifs
Motifs were modeled by a matrix indicating the frequency of each nucleotide (A,
C, G, T) at each position. This representation assumes that different positions within a
motif are independent.
Motif score
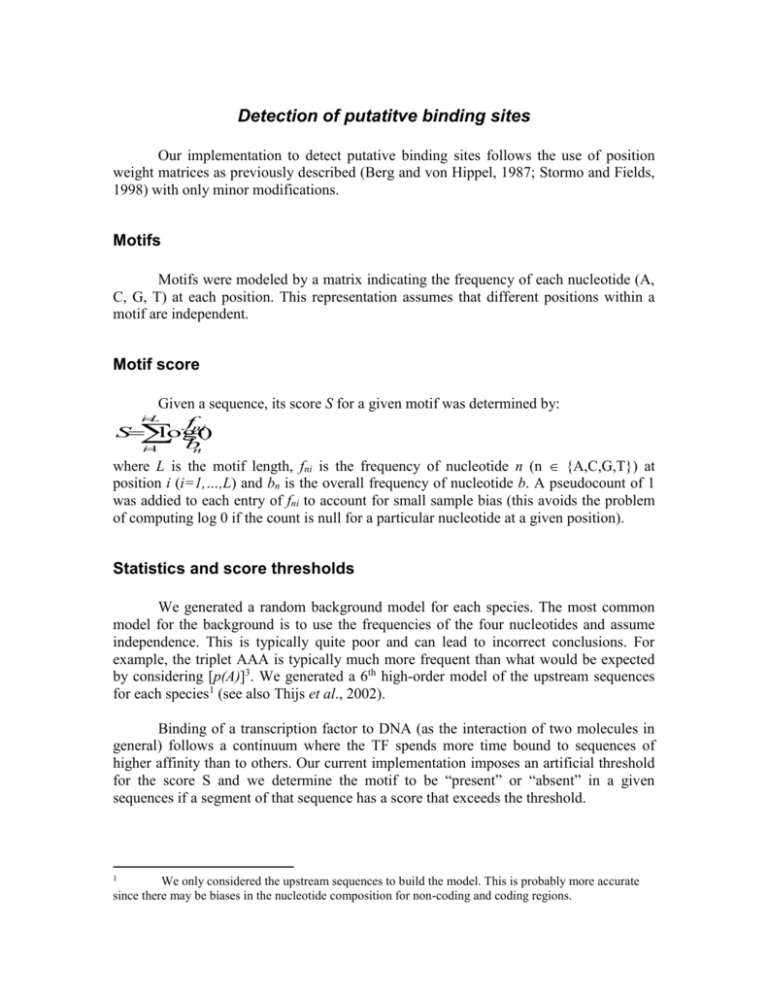
Given a sequence, its score S for a given motif was determined by:
fni
S
log(
)
b
i
1
n
where L is the motif length, fni is the frequency of nucleotide n (n {A,C,G,T}) at
position i (i=1,…,L) and bn is the overall frequency of nucleotide b. A pseudocount of 1
was addied to each entry of fni to account for small sample bias (this avoids the problem
of computing log 0 if the count is null for a particular nucleotide at a given position).
iL
Statistics and score thresholds
We generated a random background model for each species. The most common
model for the background is to use the frequencies of the four nucleotides and assume
independence. This is typically quite poor and can lead to incorrect conclusions. For
example, the triplet AAA is typically much more frequent than what would be expected
by considering [p(A)]3. We generated a 6th high-order model of the upstream sequences
for each species1 (see also Thijs et al., 2002).
Binding of a transcription factor to DNA (as the interaction of two molecules in
general) follows a continuum where the TF spends more time bound to sequences of
higher affinity than to others. Our current implementation imposes an artificial threshold
for the score S and we determine the motif to be “present” or “absent” in a given
sequences if a segment of that sequence has a score that exceeds the threshold.
1
We only considered the upstream sequences to build the model. This is probably more accurate
since there may be biases in the nucleotide composition for non-coding and coding regions.
The selection of the threshold is a compromise between selectivity and sensitivity
(a low threshold yields many false positives but is unlikely to miss many real binding
sites while the reverse is true for a more stringent threshold). We can define a min_fp
(low false positive threshold) and a min_fn (low false negative threshold).
Definition of min_fp
For each motif, we scan every possible position in an artifical sequence of length
107 generated according to the random model to compute a distribution of the scores S
under this null hypothesis. A threshold t was obtained by considering the score that left a
specified fraction of the cases out. In general, a threshold corresponding to a probability
of random occurrence of 10-4 was used. This approach controls the number of false
positives.
Determination of min_fn
Given a set of sequences that were used to define the motif, we compute the score
S for each of those sequences. We then take the threshold as the 5th percentile of this
distribution (i.e. the maximum score value that leaves out < 5% of the sequences used to
define the motif).
The trade-off between sensitivity and specificity for TF binding sites has been
discussed elsewhere (see for example Ficket, 1996)
References
Berg, O., and von Hippel, P. (1987). Selection of DNA binding sites by regulatory
proteins: Statistical-mechanical theory and application to operators and promoters.
Journal of Molecular Biology 193, 723-750.
Stormo, G. D., and Fields, D. S. (1998). Specificity, free energy and information content
in protein-DNA interactions. Trends Biochem Sci 23, 109-13.
Thijs, G., Marchal, K., Lescot, M., Rombauts, S., De Moor, B., Rouze, P., and Moreau,
Y. (2002). A Gibbs sampling method to detect overrepresented motifs in the upstream
regions of coexpressed genes. Journal of Computational Biology 9, 447-464.
Fickett, J. (1996). Quantitative discrimination of MEF2 sites. Molecular Cell Biology 16,
437-441.
