cor821
advertisement
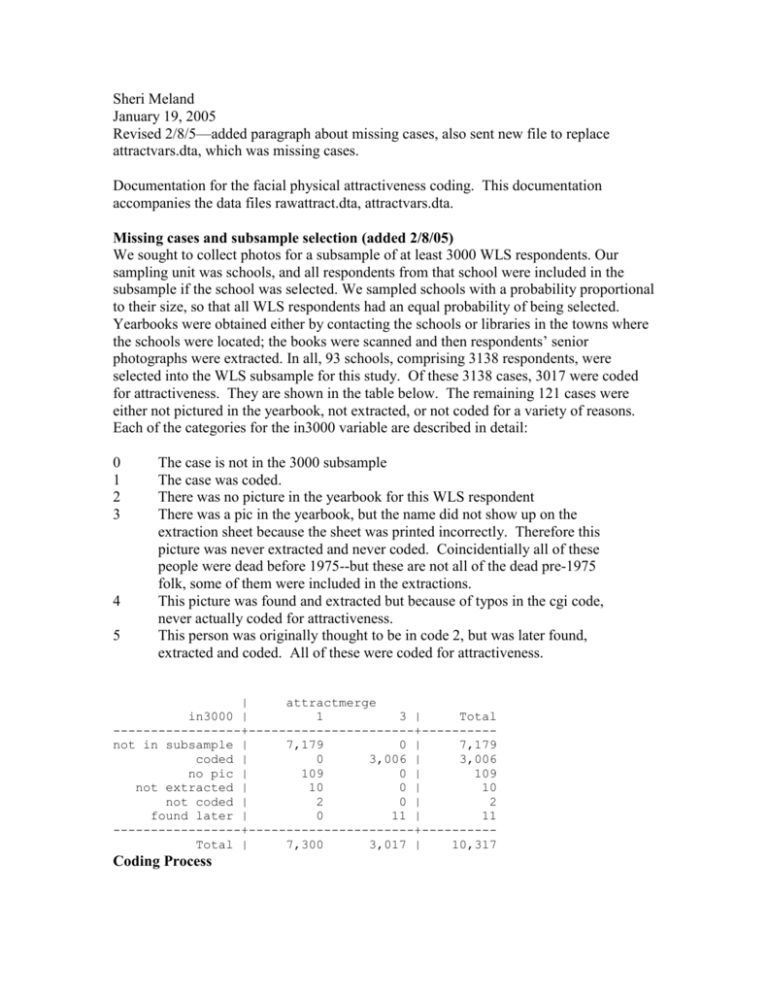
Sheri Meland January 19, 2005 Revised 2/8/5—added paragraph about missing cases, also sent new file to replace attractvars.dta, which was missing cases. Documentation for the facial physical attractiveness coding. This documentation accompanies the data files rawattract.dta, attractvars.dta. Missing cases and subsample selection (added 2/8/05) We sought to collect photos for a subsample of at least 3000 WLS respondents. Our sampling unit was schools, and all respondents from that school were included in the subsample if the school was selected. We sampled schools with a probability proportional to their size, so that all WLS respondents had an equal probability of being selected. Yearbooks were obtained either by contacting the schools or libraries in the towns where the schools were located; the books were scanned and then respondents’ senior photographs were extracted. In all, 93 schools, comprising 3138 respondents, were selected into the WLS subsample for this study. Of these 3138 cases, 3017 were coded for attractiveness. They are shown in the table below. The remaining 121 cases were either not pictured in the yearbook, not extracted, or not coded for a variety of reasons. Each of the categories for the in3000 variable are described in detail: 0 1 2 3 4 5 The case is not in the 3000 subsample The case was coded. There was no picture in the yearbook for this WLS respondent There was a pic in the yearbook, but the name did not show up on the extraction sheet because the sheet was printed incorrectly. Therefore this picture was never extracted and never coded. Coincidentially all of these people were dead before 1975--but these are not all of the dead pre-1975 folk, some of them were included in the extractions. This picture was found and extracted but because of typos in the cgi code, never actually coded for attractiveness. This person was originally thought to be in code 2, but was later found, extracted and coded. All of these were coded for attractiveness. | attractmerge in3000 | 1 3 | Total -----------------+----------------------+---------not in subsample | 7,179 0 | 7,179 coded | 0 3,006 | 3,006 no pic | 109 0 | 109 not extracted | 10 0 | 10 not coded | 2 0 | 2 found later | 0 11 | 11 -----------------+----------------------+---------Total | 7,300 3,017 | 10,317 Coding Process The attractiveness coding was conducted during the summer of 2004. Participants of the Madison Senior Scholars program were recruited to look at and code a randomly selected sample of 3007 1957 WLS respondent yearbook photos and a sub sample of 258 1956 WLS respondent yearbook photos. Thirty-three different judges whose ages ranged from 63 to 91 years (average of 78.5) rated the photos. Each yearbook photo was rated by six men and six women using a photo-labeled 11-point rating scale, with end points labeled as “not at all attractive” (=1) and “extremely attractive” (=11). Photos were divided into ten groups of roughly 300 photos per group and a final group of the 1956 photos. Judges rated one set of 300 per session and were required to have a break of at least 12 hours between coding sessions. Several judges coded multiple sets of photos, a few coded all eleven sets of photos. Data File: rawattract.dta This data file contains the raw attractiveness codes. Each observation corresponds to one judge, the variables are described in detail below: Coder This variable contains a unique identifier for each judge. The identifier is appended with the number 56 if it contains the data for the session in which the judge coded the 1956 photos. Male This variable equals a 1 if the judge was male and a 0 if the judge was female. Birthday This variable contains the birthday of the judge. To calculate the person’s age at the time of coding, for most respondents on can subtract the year of birth from 2004. A couple of respondents has birthdays during the summer and in fact, between coding sessions. The date they coded each file is available for those who want a more precise age at time of coding. r###### The series of variables that are identified by the letter r followed by a string of six numbers contain each respondent’s attractiveness code for the corresponding photograph. The six digit number corresponds to the WLS identifying idswl number for each WLS respondent. Data File: attractvars.dta This data file contains the attractiveness codes in a more useable format. There are several versions of the attractiveness rating for each WLS respondent, aggregated in various ways across the 12 judges. Each of the variables are described in detail below: Idswl Idswl is the sewell id number that will be used to merge this data with the rest of the WLS data. Pa_rate This set of variables contains the averaged attractiveness rating across all the judges that coded that photo. It is simply a mathematical average of the individual ratings. Pa_rate_male and _female contain the averaged attractiveness rating across only the male or female judges that coded that photo. Pa_56_rate This set of variables contains the averaged attractiveness rating for the 1956 photo of the WLS respondent. Only the 258 WLS respondents for which 1956 photos were coded have non missing values for any of the attractiveness variables with the _56_ insert. Any of the other variable types with the _56_ insert are values only for this subset of 1956 photos. Norm_ This set of variables contains the averaged attractiveness rating across all the judges’ normed codes for that photo. Codes were normed by subtracting each judge’s average rating from the original code. The resulting normed codes were then averaged to create the corresponding norm_ codes. Std_ This set of variables contains the averaged attractiveness rating across all the judges’ standardized codes for that photo. Codes were standardized using STATA’s std function and then dividing by each judge’s standard deviation. The resulting standardized codes were then averaged to create the corresponding std_ codes. _male or _female Variables that have the suffix _male or _female indicate that they were aggregated only across judges of that gender. _trunc (also _mtrunc and _ftrunc) Variables that have the suffix _trunc were averaged using only the middle ten scores. The two most extreme codes for each photo were dropped prior to averaging in order to avoid the effect of outliers. Mtrunc indicates that the codes were aggregated only across the middle four male judges; ftrunc indicates that the codes were aggregated only across the middle four female judges.
