CAGE data set: Your collaborator has made a CAGE experiment
advertisement
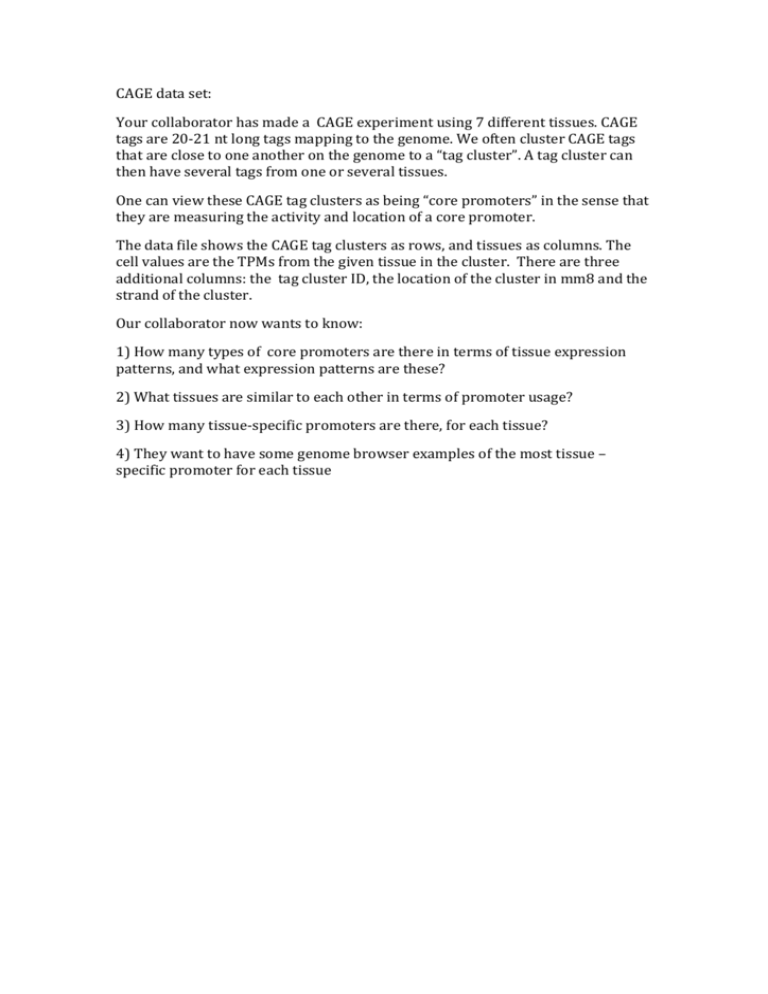
CAGE data set: Your collaborator has made a CAGE experiment using 7 different tissues. CAGE tags are 20-21 nt long tags mapping to the genome. We often cluster CAGE tags that are close to one another on the genome to a “tag cluster”. A tag cluster can then have several tags from one or several tissues. One can view these CAGE tag clusters as being “core promoters” in the sense that they are measuring the activity and location of a core promoter. The data file shows the CAGE tag clusters as rows, and tissues as columns. The cell values are the TPMs from the given tissue in the cluster. There are three additional columns: the tag cluster ID, the location of the cluster in mm8 and the strand of the cluster. Our collaborator now wants to know: 1) How many types of core promoters are there in terms of tissue expression patterns, and what expression patterns are these? 2) What tissues are similar to each other in terms of promoter usage? 3) How many tissue-specific promoters are there, for each tissue? 4) They want to have some genome browser examples of the most tissue – specific promoter for each tissue
