Practical 1
advertisement
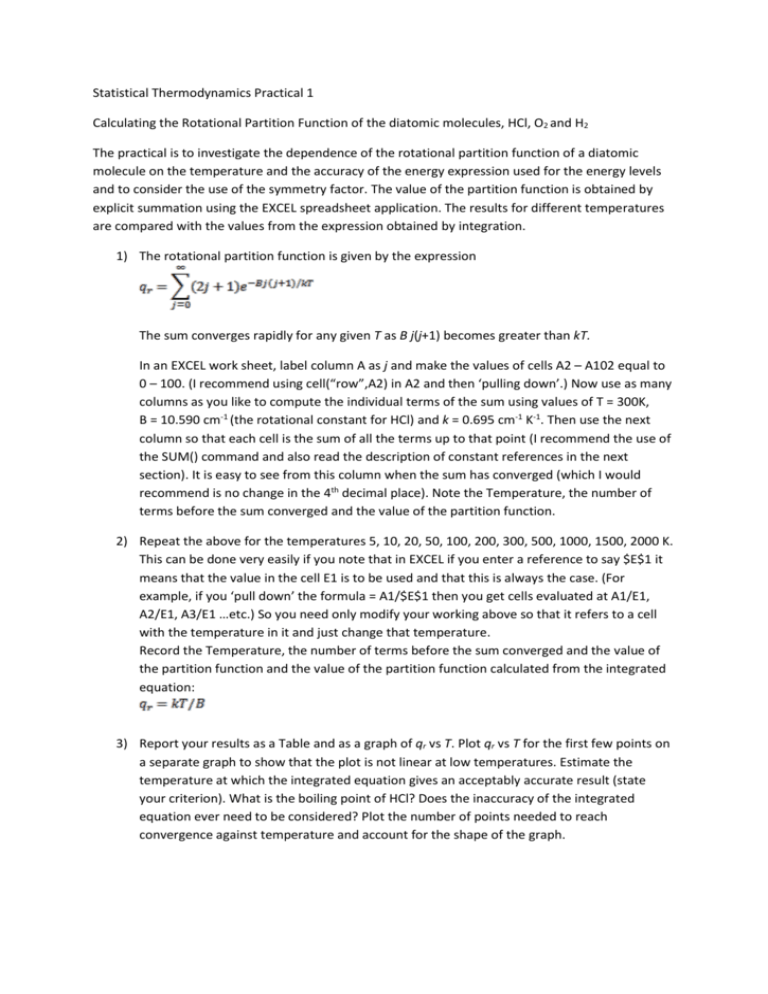
Statistical Thermodynamics Practical 1 Calculating the Rotational Partition Function of the diatomic molecules, HCl, O2 and H2 The practical is to investigate the dependence of the rotational partition function of a diatomic molecule on the temperature and the accuracy of the energy expression used for the energy levels and to consider the use of the symmetry factor. The value of the partition function is obtained by explicit summation using the EXCEL spreadsheet application. The results for different temperatures are compared with the values from the expression obtained by integration. 1) The rotational partition function is given by the expression The sum converges rapidly for any given T as B j(j+1) becomes greater than kT. In an EXCEL work sheet, label column A as j and make the values of cells A2 – A102 equal to 0 – 100. (I recommend using cell(“row”,A2) in A2 and then ‘pulling down’.) Now use as many columns as you like to compute the individual terms of the sum using values of T = 300K, B = 10.590 cm-1 (the rotational constant for HCl) and k = 0.695 cm-1 K-1. Then use the next column so that each cell is the sum of all the terms up to that point (I recommend the use of the SUM() command and also read the description of constant references in the next section). It is easy to see from this column when the sum has converged (which I would recommend is no change in the 4th decimal place). Note the Temperature, the number of terms before the sum converged and the value of the partition function. 2) Repeat the above for the temperatures 5, 10, 20, 50, 100, 200, 300, 500, 1000, 1500, 2000 K. This can be done very easily if you note that in EXCEL if you enter a reference to say $E$1 it means that the value in the cell E1 is to be used and that this is always the case. (For example, if you ‘pull down’ the formula = A1/$E$1 then you get cells evaluated at A1/E1, A2/E1, A3/E1 …etc.) So you need only modify your working above so that it refers to a cell with the temperature in it and just change that temperature. Record the Temperature, the number of terms before the sum converged and the value of the partition function and the value of the partition function calculated from the integrated equation: 3) Report your results as a Table and as a graph of qr vs T. Plot qr vs T for the first few points on a separate graph to show that the plot is not linear at low temperatures. Estimate the temperature at which the integrated equation gives an acceptably accurate result (state your criterion). What is the boiling point of HCl? Does the inaccuracy of the integrated equation ever need to be considered? Plot the number of points needed to reach convergence against temperature and account for the shape of the graph. 4) A more accurate expression for the energy of the jth level is: Ej = B j ( j + 1) – D j2 ( j + 1)2. For HCl, the centrifugal distortion constant D = 4.61 x 10⁻⁴ cm-1; calculate qr using this energy expression at T = 10 K and T = 2000 K. Comment on your results. 5) For the molecule O2, the rotational constant is 1.445 cm-1 and because the molecule is symmetric and the atoms have zero nuclear spin, only energy levels with odd number values of j are occupied. Calculate qr for O2 at 300K by explicit summation (copy your previous method and modify it appropriately; you may want to look at the SUMIF() function) and compare your result with the equation: qr = kT / σB where σ, the symmetry factor equals 2. 6) For the molecule H2, the rotational constant is 60.8 cm-1 (the largest in chemistry) and because the molecule is symmetric and the atoms have half integer nuclear spin, energy levels with odd number values of j are occupied 3 fold more than levels with even values of j. Calculate qr for H2 at 50K, 150 and 300K by explicit summation (copy your previous method and modify it appropriately) and compare your result with the equation: qr = kT / σB where σ, the symmetry factor equals 2. Write Up: The Write Up should be a WORD file with the results from sections 2-6 clearly presented. There is no need for a discussion of the background theory. The report must be clearly laid out and annotated and the clarity and quality of the presentations of the Table and Graphs will be form part of the marking. Where comments are asked for (sections 3 and 4) some sentences of comment or discussion are expected. A brief description of which EXCEL functions were used and in what part of the problem should complete the write up. The EXCEL file you used should be submitted as well. Whilst this will not be marked, it would help if it was annotated sufficiently to understand how it relates to the results. Email the WORD and EXCEL file to p.brint@ucc.ie
