Statistical Reasoning Notes
advertisement
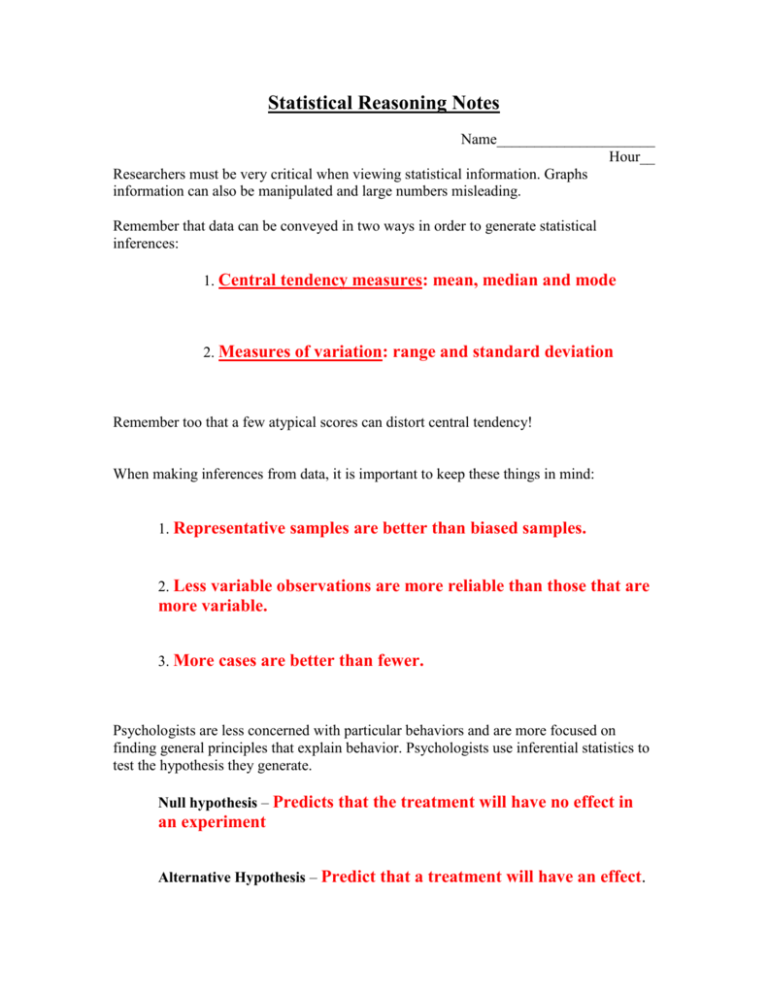
Statistical Reasoning Notes Name_____________________ Hour__ Researchers must be very critical when viewing statistical information. Graphs information can also be manipulated and large numbers misleading. Remember that data can be conveyed in two ways in order to generate statistical inferences: 1. Central tendency measures: mean, median and mode 2. Measures of variation: range and standard deviation Remember too that a few atypical scores can distort central tendency! When making inferences from data, it is important to keep these things in mind: 1. Representative samples are better than biased samples. 2. Less variable observations are more reliable than those that are more variable. 3. More cases are better than fewer. Psychologists are less concerned with particular behaviors and are more focused on finding general principles that explain behavior. Psychologists use inferential statistics to test the hypothesis they generate. Null hypothesis – Predicts that the treatment will have no effect in an experiment Alternative Hypothesis – Predict that a treatment will have an effect. Inferential statistics allow researchers the possibility of rejecting or accepting the null hypothesis with a certain level of confidence. Tests such as this are significant because they enable researchers to examine whether the effects are likely because of treatment or a normal variation amongst the sample population. Researchers in psychology do not want to conclude that differences exist if in fact they do not. Two primary errors occur when testing a hypothesis: Type I error – Refers to the conclusion that a difference exists when in fact it does not. Type II error – Refers to the conclusion that there is no difference when in fact there is. Note that statistical decisions are made using the following model The Null is TRUE The Null is FALSE Correct decision! Type I error You accept the null Type II error Correct decision! You reject the null http://www.experiment-resources.com/hypothesis-testing.html http://www.youtube.com/watch?v=5N7L1cGCL-w http://joshmadison.com/2007/12/02/mms-color-distribution-analysis/


