FY09 Spring Operating Review - University of Alaska System
advertisement
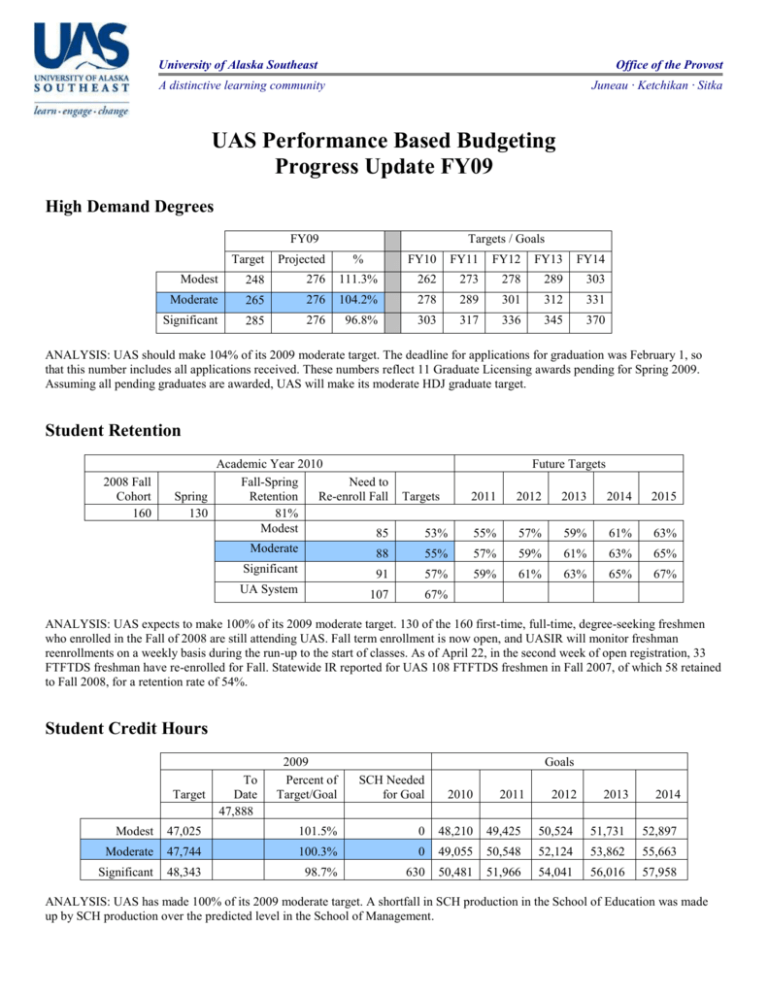
University of Alaska Southeast Office of the Provost A distinctive learning community Juneau · Ketchikan · Sitka UAS Performance Based Budgeting Progress Update FY09 High Demand Degrees FY09 Target Projected Modest 248 276 Moderate 265 Significant 285 Targets / Goals % FY10 FY11 FY12 FY13 FY14 111.3% 262 273 278 289 303 276 104.2% 278 289 301 312 331 276 96.8% 303 317 336 345 370 ANALYSIS: UAS should make 104% of its 2009 moderate target. The deadline for applications for graduation was February 1, so that this number includes all applications received. These numbers reflect 11 Graduate Licensing awards pending for Spring 2009. Assuming all pending graduates are awarded, UAS will make its moderate HDJ graduate target. Student Retention 2008 Fall Cohort 160 Academic Year 2010 Fall-Spring Need to Spring Retention Re-enroll Fall 130 81% Modest 85 Future Targets Targets 2011 2012 2013 2014 2015 53% 55% 57% 59% 61% 63% Moderate 88 55% 57% 59% 61% 63% 65% Significant 91 57% 59% 61% 63% 65% 67% UA System 107 67% ANALYSIS: UAS expects to make 100% of its 2009 moderate target. 130 of the 160 first-time, full-time, degree-seeking freshmen who enrolled in the Fall of 2008 are still attending UAS. Fall term enrollment is now open, and UASIR will monitor freshman reenrollments on a weekly basis during the run-up to the start of classes. As of April 22, in the second week of open registration, 33 FTFTDS freshman have re-enrolled for Fall. Statewide IR reported for UAS 108 FTFTDS freshmen in Fall 2007, of which 58 retained to Fall 2008, for a retention rate of 54%. Student Credit Hours Target To Date 47,888 2009 Percent of Target/Goal Goals SCH Needed for Goal 2010 2011 2012 2013 2014 Modest 47,025 101.5% 0 48,210 49,425 50,524 51,731 52,897 Moderate 47,744 100.3% 0 49,055 50,548 52,124 53,862 55,663 Significant 48,343 98.7% 630 50,481 51,966 54,041 56,016 57,958 ANALYSIS: UAS has made 100% of its 2009 moderate target. A shortfall in SCH production in the School of Education was made up by SCH production over the predicted level in the School of Management. Research Expenditures 2009 Target Targets / Goals ($ Millions) Projected % 2010 2011 2012 2013 2014 Modest 1.0 1.15 115% 1.0 1.0 1.0 1.0 1.0 Moderate 1.5 1.15 76% 1.5 1.5 1.5 1.5 1.5 Significant 2.0 1.15 57% 2.0 2.0 2.0 2.0 2.0 ANALYSIS: Research Expenditures for FY08 totaled $1.818 million. This figure represents an $800,000 increase from the previous fiscal year and results from federal research awards (22) and awards from the UA Foundation. Total projected restricted research expenditures for FY09 Modest goals in this metric (at 115%). Two essential factors will influence the management of this area in the near term. First, half of the existing and new awards will conclude between July and September, 2010. This circumstance will require increased activity among UAS researchers to identify and attract funding to replace current awards. Second, there is a need to articulate grant activity more tightly within an organizational vision to accommodate both the provisions of institutional accreditation and create better synergies among Schools and programs around UAS strategic goals. This articulation may have implications for grant activity during the initial phases of its diffusion among researchers. University Generated Revenue Target FY09 Actual % Targets / Goals ($ Millions) 2010 2011 2012 2013 2014 Modest 20,167,445 20,016,528 99.3% 20.8 21.0 21.2 21.5 21.8 Moderate 20,284,152 20,016,528 98.7% 21.0 21.3 21.7 22.1 22.5 Significant 20,314,825 20,016,528 98.5% 21.1 21.5 21.9 22.4 22.8 ANALYSIS: UAS should make 99.3% of its modest UGR goal in FY09. This performance rate is due in large part to reduced grant revenue (due to expiring grants) and CIP receipts (due to few capital projects coming on line than anticipated). Non-Credit Production Training Categories Business / Work Construction / Maintenance Healthcare Marine Transportation / Operations Natural Environment Personal Enrichment Total NCUs Summer 2007 46 116 25 0 0 40 227 Fall 2007 63 4 162 356 16 22 623 Spring 2008 109 295 193 516 134 34 1281 Summer 2008 6 0 59 16 29 23 133 Fall 2008 6 26 175 323 34 33 597 Spring 2009 53 132 218 447 98 62 1010 Total 283 573 832 1658 311 214 3871 % 7% 15% 21% 43% 8% 6% 100% ANALYSIS: UAS earns a significant number of non-credit units (NCU). Many of the NCU courses offered are connected to UAS’s degree programs (e.g. Marine Transportation, Health Sciences, and Construction Technology). UAS anticipates NCU growth from the phase out of the Environmental Technology program, expansion of the Professional Education Center’s NCU offering into management and supervision, and further enrollment in the Career Training for Ports and Marinas courses. UAS looks to improve its infrastructure to better respond to industry and employer training needs in a timely manner and to more accurately record non-credit activity. Note: These numbers differ from Statewide data because UAS has analyzed contact hours for all its non-credit offerings in 2007 and 2008. University of Alaska Southeast Office of the Provost
