Practice Exam Chapter 3 - Numerical Descriptive Measures
advertisement
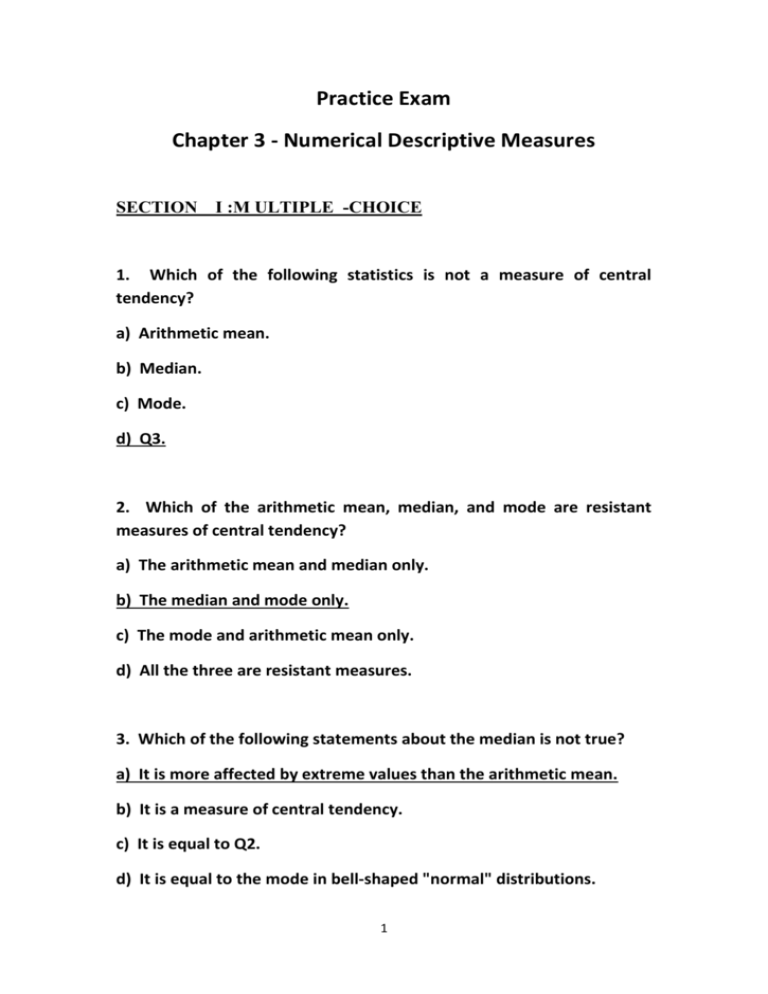
Practice Exam Chapter 3 - Numerical Descriptive Measures SECTION I :M ULTIPLE -CHOICE 1. Which of the following statistics is not a measure of central tendency? a) Arithmetic mean. b) Median. c) Mode. d) Q3. 2. Which of the arithmetic mean, median, and mode are resistant measures of central tendency? a) The arithmetic mean and median only. b) The median and mode only. c) The mode and arithmetic mean only. d) All the three are resistant measures. 3. Which of the following statements about the median is not true? a) It is more affected by extreme values than the arithmetic mean. b) It is a measure of central tendency. c) It is equal to Q2. d) It is equal to the mode in bell-shaped "normal" distributions. 1 4. In a perfectly symmetrical distribution a) the range equals the interquartile range. b) the interquartile range equals the arithmetic mean. c) the median equals the arithmetic mean. d) the variance equals the standard deviation. 5. In general, which of the following descriptive summary measures cannot be easily approximated from a boxplot? a) The variance. b) The range. c) The interquartile range. d) The median. 6. Which descriptive summary measures are considered to be resistant statistics? a) The arithmetic mean and standard deviation. b) The interquartile range and range. c) The mode and variance. d) The median and interquartile range. 7. In perfectly symmetrical distributions, which of the following is NOT a correct statement? a) The distance from Q1 to Q2 equals to the distance from Q2 to Q3. 2 b) The distance from the smallest observation to Q1 is the same as the distance from Q3 to the largest observation. c) The distance from the smallest observation to Q2 is the same as the distance from Q2 to the largest observation. d) The distance from Q1 to Q3 is half of the distance from the smallest to the largest observation. 8. Which of the following is NOT sensitive to extreme values? a) The range. b) The standard deviation. c) The interquartile range. d) The coefficient of variation. 9. According to the Chebyshev rule, at least 75% of all observations in any data set are contained within a distance of how many standard deviations around the mean? a) 1 b) 2 c) 3 d) 4 10. According to the Chebyshev rule, at least what percentage of the observations in any data set are contained within a distance of 2 standard deviations around the mean? a) 67% b) 75% 3 c) 88.89% d) 95% SECTION II: TRUE OR FALSE 1. The median of the values 3.4, 4.7, 1.9, 7.6, and 6.5 is 1.9. False 2. In a set of numerical data, the value for Q3 can never be smaller than the value for Q1. True 3. In right-skewed distributions, the distance from Q3 to the largest observation exceeds the distance from the smallest observation to Q1. True 4. A boxplot is a graphical representation of a 5-number summary. True 5. The line drawn within the box of the boxplot always represents the median. True 4 6. A population with 200 elements has an arithmetic mean of 10. From this information, it can be shown that the population standard deviation is 15. False 7. An economics professor bases his final grade on homework, two midterm examinations, and a final examination. The homework counts 10% toward the final grade, while each midterm examination counts 25%. The remaining portion consists of the final examination. If a student scored 95% in homework, 70% on the first midterm examination, 96% on the second midterm examination, and 72% on the final, his final average is 79.8%. True 8. The coefficient of variation measures variability in a data set relative to the size of the arithmetic mean. True 9. The coefficient of variation is a measure of central tendency in the data. False 10. If a set of data is perfectly symmetrical, the arithmetic mean must be identical to the median. True 5 11. If the data set is approximately bell-shaped, the empirical rule will more accurately reflect the greater concentration of data close to the mean as compared to the Chebyshev rule. True 12. The Z scores can be used to identify outliers. True 13. As a general rule, an observation is considered an extreme value if its Z score is greater than −3. False 14. As a general rule, an observation is considered an extreme value if its Z score is less than −3. True 15. The Z score of an observation measures how many standard deviations is the value from the mean. True TABLE (A) Health care issues are receiving much attention in both academic and political arenas. A sociologist recently conducted a survey of citizens over 60 years of age whose net worth is too high to qualify for Medicaid and have no private health insurance. The ages of 25 uninsured senior citizens were as follows: 60 61 62 63 64 65 66 68 68 69 70 73 73 6 74 75 76 76 81 81 82 86 87 89 90 92 1. Referring to TABLE (A), calculate the arithmetic mean age of the uninsured senior citizens to the nearest hundredth of a year. 74.04 years 2. Referring to TABLE (A), identify the median age of the uninsured senior citizens. 73 years 3. Referring to TABLE (A), identify the first quartile of the ages of the uninsured senior citizens. 65.5 years 4. Referring to TABLE (A), identify the third quartile of the ages of the uninsured senior citizens. 81.5 years 5. Referring to TABLE (A), identify the interquartile range of the ages of the uninsured senior citizens. 16 years 6. Referring to TABLE (A), identify which of the following is the correct statement. a) One fourth of the senior citizens sampled are below 65.5 years of age. 7 b) The middle 50% of the senior citizens sampled are between 65.5 and 73.0 years of age. c) The average age of senior citizens sampled is 73.5 years of age. d) All of the above are correct. 7. Referring to TABLE (A), identify which of the following is the correct statement. a) One fourth of the senior citizens sampled are below 64 years of age. b) The middle 50% of the senior citizens sampled are between 65.5 and 73.0 years of age. c) 25% of the senior citizens sampled are older than 81.5 years of age. d) All of the above are correct. 8. Referring to TABLE (A), what type of shape does the distribution of the sample appear to have? Slightly positive or right-skewed. 9. Referring to TABLE (A), calculate the variance of the ages of the uninsured senior citizens correct to the nearest hundredth of a year squared. 94.96 years 8 10. Referring to TABLE (A), calculate the standard deviation of the ages of the uninsured senior citizens correct to the nearest hundredth of a year. 9.74 years 11. Referring to TABLE (A), calculate the coefficient of variation of the ages of the uninsured senior citizens. 13.16% 9
