Assessment 3 graph-final
advertisement
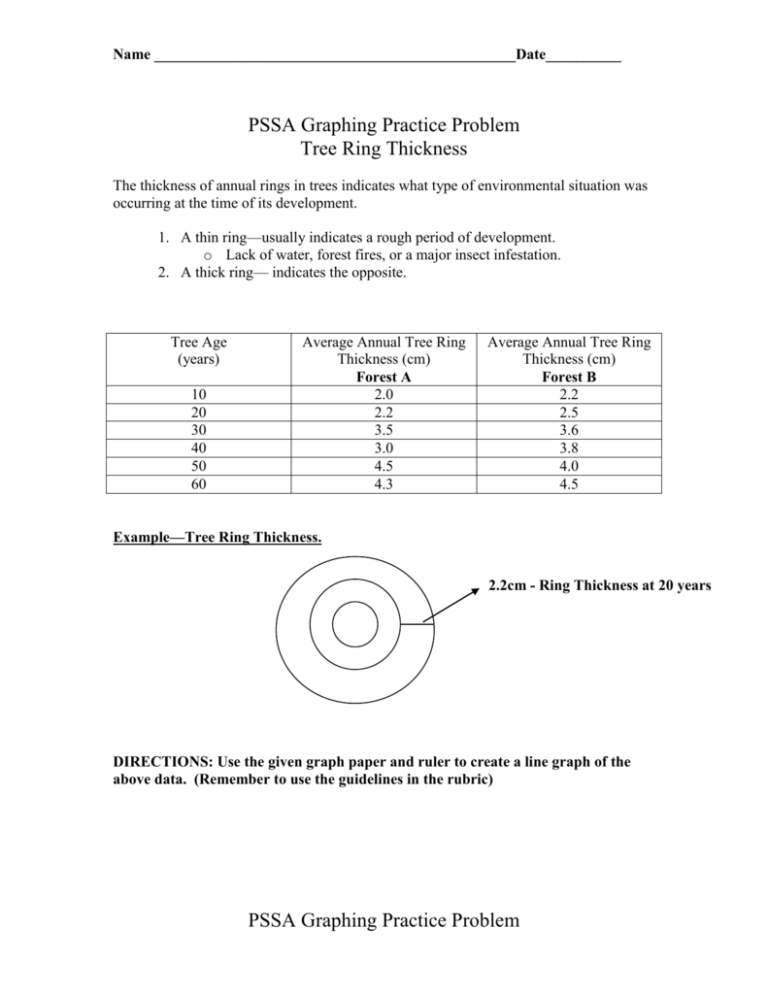
Name ________________________________________________Date__________ PSSA Graphing Practice Problem Tree Ring Thickness The thickness of annual rings in trees indicates what type of environmental situation was occurring at the time of its development. 1. A thin ring—usually indicates a rough period of development. o Lack of water, forest fires, or a major insect infestation. 2. A thick ring— indicates the opposite. Tree Age (years) 10 20 30 40 50 60 Average Annual Tree Ring Thickness (cm) Forest A 2.0 2.2 3.5 3.0 4.5 4.3 Average Annual Tree Ring Thickness (cm) Forest B 2.2 2.5 3.6 3.8 4.0 4.5 Example—Tree Ring Thickness. 2.2cm - Ring Thickness at 20 years DIRECTIONS: Use the given graph paper and ruler to create a line graph of the above data. (Remember to use the guidelines in the rubric) PSSA Graphing Practice Problem Name ________________________________________________Date__________ Tree Ring Thickness The thickness of annual rings in trees indicates what type of environmental situation was occurring at the time of its development. 3. 4. A thin ring—usually indicates a rough period of development. o Lack of water, forest fires, or a major insect infestation. A thick ring— indicates the opposite. DIRECTIONS: Use the given graph to complete the following: 1. What year showed the greatest difference in ring thickness between forest A and forest B? ______________ 2. In forest B, what is the age of trees with an average thickness of 2.5cm? ______________ 3. Which forest (A or B) experienced a decrease in average ring thickness between any 10-year period? (Support your answer with quantitative data.) __________________________________________________________________ __________________________________________________________________ __________________________________________________________________ __________________________________________________________________ __________________________________________________________________ __________________________________________________________________ __________________________________________________________________ __________________________________________________________________ __________________________________________________________________ __________________________________________________________________ __________________________________________________________________ __________________________________________________________________ __________________________________________________________________ __________________________________________________________________ Name ________________________________________________Date__________ 4. What is the relationship between the age of a tree (years) and the average thickness (cm) in Forest B? (Support your answer qualitatively or quantitatively.) __________________________________________________________________ __________________________________________________________________ __________________________________________________________________ __________________________________________________________________ __________________________________________________________________ __________________________________________________________________ __________________________________________________________________ __________________________________________________________________ __________________________________________________________________ __________________________________________________________________ __________________________________________________________________ __________________________________________________________________ __________________________________________________________________ __________________________________________________________________ __________________________________________________________________ __________________________________________________________________ __________________________________________________________________ __________________________________________________________________ Name ________________________________________________Date__________ 5. In forest B, predict the average annual tree ring thickness of a 70-year old tree (Explain your answer using both qualitative and quantitative data.) _____________________________________________________________________ _____________________________________________________________________ _____________________________________________________________________ _____________________________________________________________________ _____________________________________________________________________ _____________________________________________________________________ _____________________________________________________________________ _____________________________________________________________________ _____________________________________________________________________ _____________________________________________________________________ _____________________________________________________________________ _____________________________________________________________________ _____________________________________________________________________ _____________________________________________________________________ _____________________________________________________________________ _____________________________________________________________________ _____________________________________________________________________ _____________________________________________________________________ _____________________________________________________________________ Name ________________________________________________Date__________ 4.8 Average thickness of tree rings (cm) 4.5 Average Thickness of Tree Rings in Forests A & B Over the Last 60 Years 4.2 3.9 3.6 3.3 Forest A Forest B 3.0 2.7 2.4 2.1 1.8 1.5 1.2 0.9 0.6 0.3 0.0 10 20 30 40 Age of trees in years 50 60 Name ________________________________________________Date__________ ANSWER KEY Right There 1. year 40 2. 20 years Conclusion 1. Forest A – between years 30 and 40 it decreases 0.5 cm. Between 50 and 60 years, it decreases 0.2 cm. 2. Increases over time OR express with data Prediction 1. anything from 4.6 cm to 5.0 cm – give example from graph and explain why
